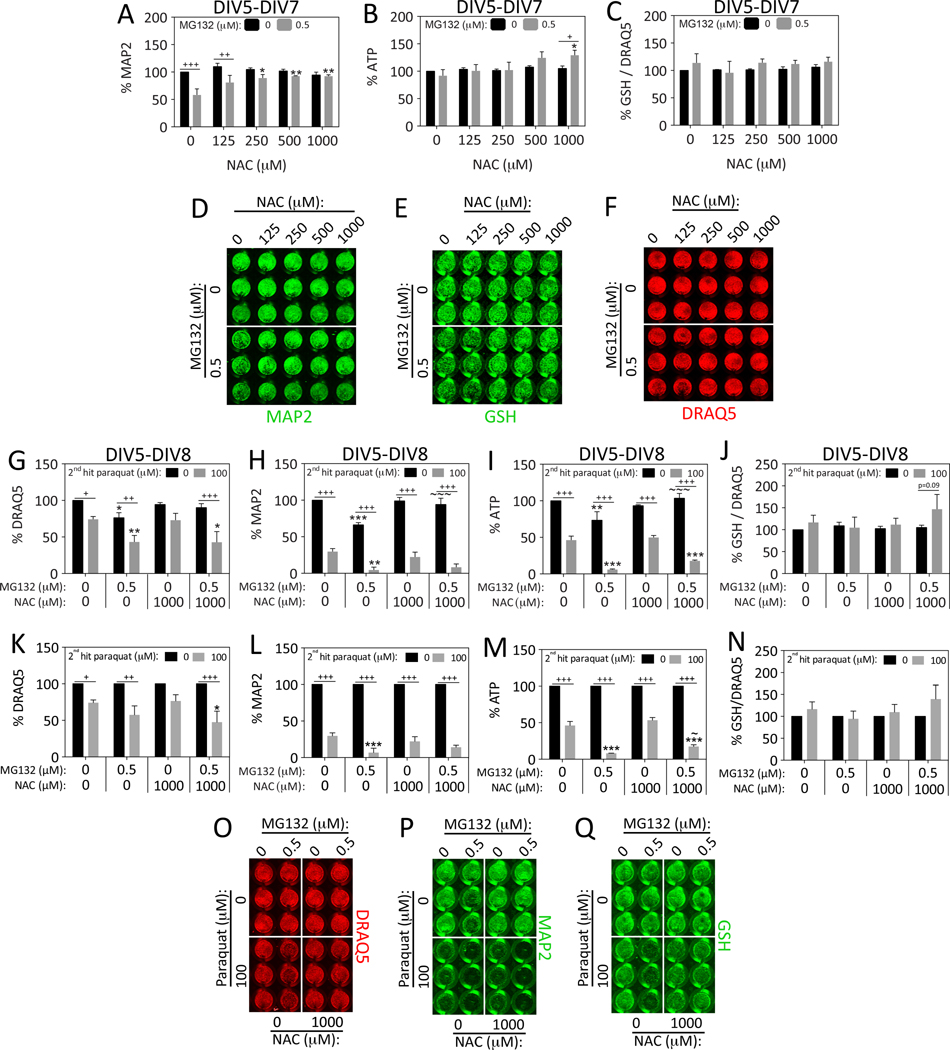
Figure 4. N-acetyl cysteine protects hippocampal neurons against proteotoxicity but not oxidative stress.
Primary hippocampal cultures were treated on DIV5 with MG132 in the absence or presence of N-acetyl cysteine (NAC). Viability was assayed 48h later on DIV7 by (A) the In-Cell Western assay for MAP2 levels, and (B) the Cell Titer Glo luminescent assay for ATP. A representative MAP2 image is shown in panel D. (C) The same treatments as shown in panels A–B were repeated and glutathione (GSH) levels were measured by the In-Cell Western technique and expressed as a function of the nuclear DRAQ5 stain. Represented images of glutathione and DRAQ5 staining are shown in panels E and F. For panels A–F: *p ≤ 0.05, **p ≤ 0.01, ***p ≤ 0.001 versus 0 μM NAC; +p ≤ 0.05, ++p ≤ 0.01, +++p ≤ 0.001 versus 0 μM MG132; two-way ANOVA followed by Bonferroni post hoc correction. (G–Q) Primary hippocampal cultures were treated on DIV5 with the 1st hit of MG132 and on DIV6 with the 2nd hit of paraquat in the absence or presence of NAC. Viability was assayed 48h later on DIV8 by (G) the nuclear stain DRAQ5, (H) the In-Cell Western assay for MAP2 levels, and (I) the Cell Titer Glo luminescent assay for ATP. Representative DRAQ5 and MAP2 images are shown in panels O and P. NAC mitigated MG132 but not paraquat toxicity and failed to protect against dual MG132/paraquat hits. Panels G–I are shown as scatterplots in Supplemental Figure 3 (D–F) to show all individual data points. (J) The same treatments as shown in panels G–I were repeated and glutathione (GSH) levels were measured by the In-Cell Western technique and expressed as a function of the nuclear DRAQ5 stain. A representative image of the glutathione In-Cell Western data is shown in panel Q. (K–N) Data shown in panels G–J were expressed as a percentage of the 0 μM 2nd hit group (each gray bar was expressed as a percentage of the adjacent black bar). Shown are the mean and SEM of 3–4 independent experiments, each performed in triplicate. For panels G–N: *p ≤ 0.05, **p ≤ 0.01, ***p ≤ 0.001 versus 0 μM 1st MG132 hit; +p ≤ 0.05, ++p ≤ 0.01, +++p ≤ 0.001 versus 0 μM 2nd paraquat hit; ~p ≤ 0.05, ~~p ≤ 0.01, ~~~p ≤ 0.001 versus 0 μM NAC; three-way ANOVA followed by Bonferroni post hoc correction.

