Figure 7.
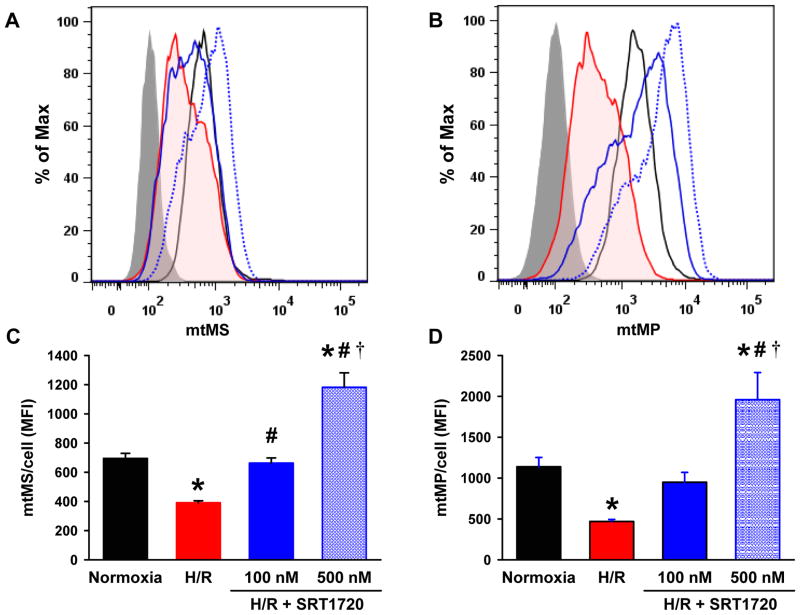
SRT1720 increases mitochondrial mass and membrane potential in H4IIE hepatocytes after hypoxia-reoxygenation (H/R). H4IIE hepatocytes underwent 6 h of oxyrase-induced hypoxia in glucose-, pyruvate- and serum-free media followed by 4 h of reoxygenation in complete media. Cells were stained with mitotracker green (A, C) and mitotracker red FM dye (B, D) to measure the mitochondrial mass (mtMS) and mitochondrial membrane potential (mtMP) per cell, respectively, by flow cytometry. (A, B) Representative histograms of flow cytometric anlaysis showing unstained (grey fill), normoxia control (black line), H/R (red shaded line), H/R plus 100 nM (blue line) or 500 nM (blue dotted line) of SRT1720. (C, D) The mean of the fluorescent intensity (MFI) of mitotracker dyes per cell. Data are presented as means ± SE (n = 6/group), representative of three independent experiments. *P < 0.05 versus control; #P < 0.05 versus H/R, †P < 0.05 versus H/R plus 100 nM SRT1720.

