
Table 2.
Image Quality Scores for the Pancreatic Duct
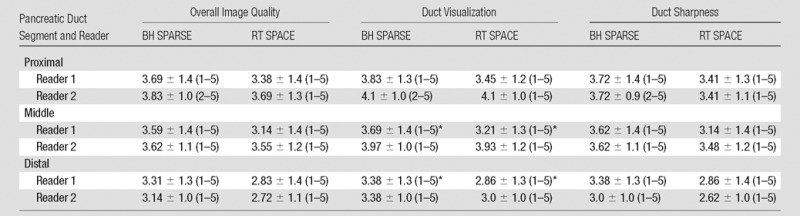
Note.–Data are means standard deviation, with range of scores in parentheses. Scores for all image quality parameters were similar or higher with BH SPARSE than with RT SPACE.
*Difference between BH SPARSE and RT SPACE scores was significant for pancreatic duct (P = .049) and distal pancreatic duct (P = .038) for reader 1.