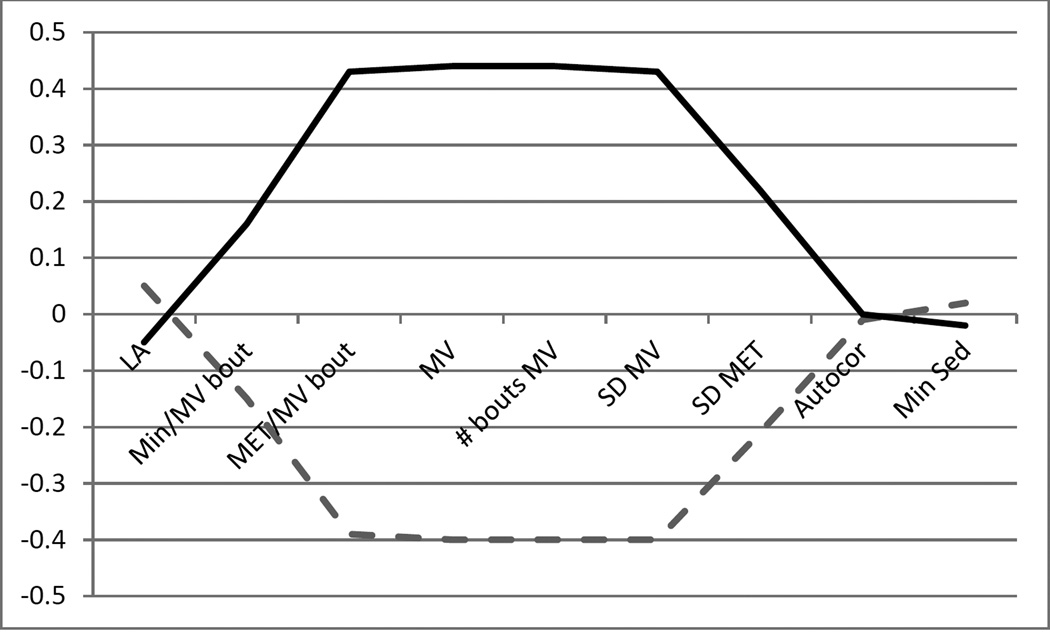
Figure 1.
PA profile and the less active and more active states. Solid (dashed) line shows the profile of more (less) active state. The vertical scale is in standardized unit of z-score.
LA= Total minutes of light activity per day
Min/MV bout= Average minutes per bout of MV activity
MET/MV bout= Average MET score per MV bout
MV = Total minutes of MV activity per day
# bouts MV = Total number of bouts of MV activity per day
SD MV = Standard deviation of total MV number of bouts per day
SD MET = Standard deviation of MET score per MV bout
Autocor = Autocorrelation between two consecutive observations in count
Min Sed = Total minutes of sedentary activity per day

