
FIGURE 1.
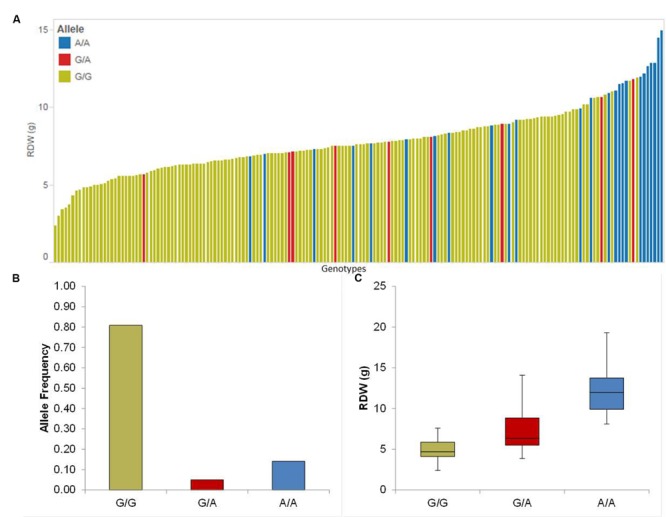
Quantification of allele based trait effect of QRdw.5H. (A) Pin plot analysis based on allelic effects for Rdw across the whole population. Genotypes are ordered based on their average Rdw in 2014 and 2015. (B) Allele frequency at QTL QRdw.5H. (C) Whisker plot for 10 randomly selected genotypes per allele to quantify the trait effect of the particular allele, except heterozygous allele. Yellow: Major allele; Red: Heterozygous allele; Blue: Minor allele.