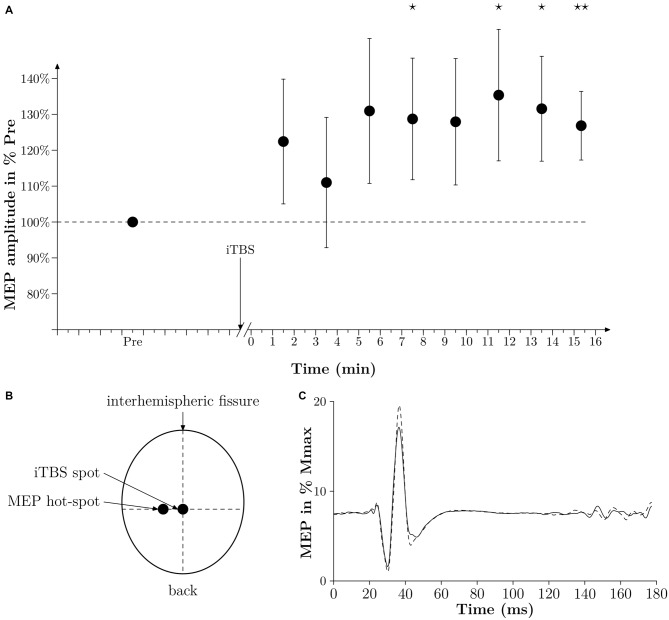
Figure 2.
Time effect of iTBS. (A) Averaged time effect of iTBS in six subjects. MEPs amplitudes done at 10% MVC are expressed as a percentage of the averaged amplitude of MEPs obtained in PRE and are plotted against time (min). Thin lines represent standard error of the mean. A star represents a p-value < 0.05, two stars represent a p-value < 0.01. (B) Drawing of the position of the coil of the TMS to induce a MEP in the vastus lateralis (VL) (MEP hot-spot) and when applying iTBS (iTBS spot). The legend “back” indicates the back of the head. (C) Averaged traces of 10 PRE MEPs (thin black line) and 10 POST MEPs (dashed line) obtained 7 min after iTBS in one subject and expressed in % Mmax. Time 0 corresponds to the time of stimulation.

