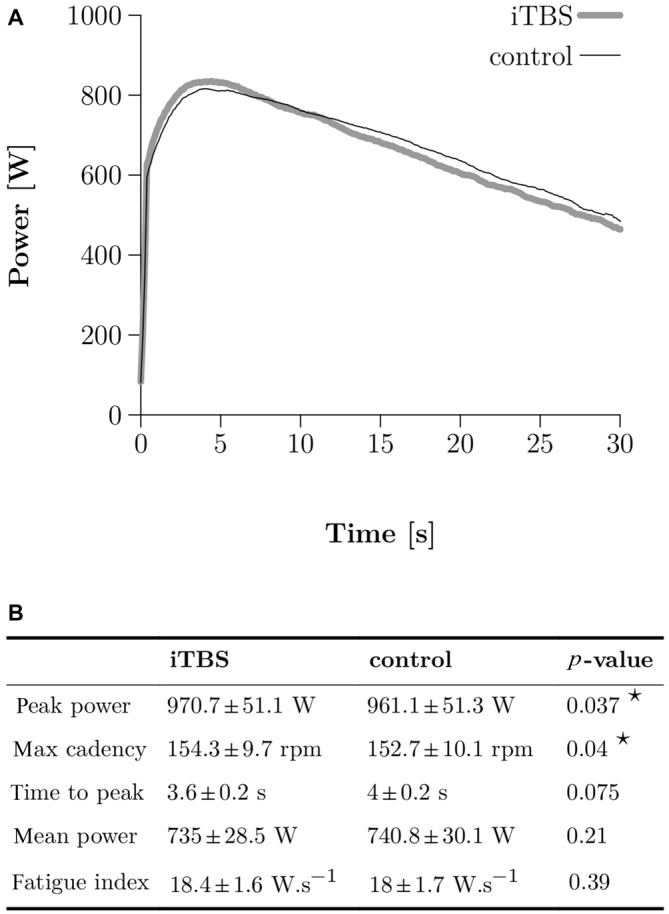
Figure 3.

Wingate Anaerobic Test (WAnT) results. (A) Two typical WAnT power curves obtained in one single subject after control (thin black line) and iTBS treatment (thick gray line). (B) Group data (N = 10) for the most important parameters, which characterize the power development in the WAnT. Bilateral paired t-tests were applied and a star corresponds to a significant result (p < 0.05).
