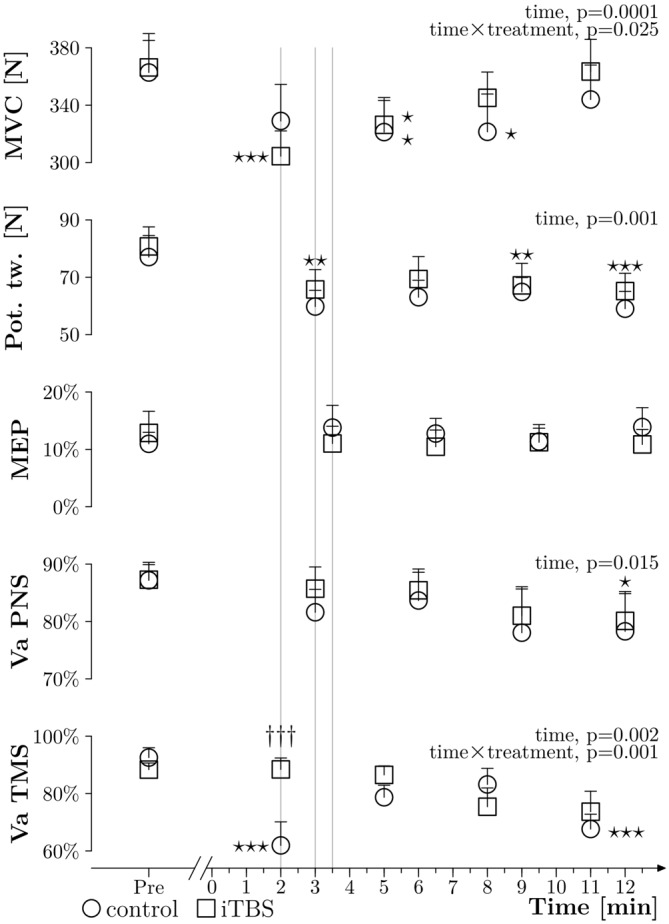
Figure 4.

General results. Grouped data (N = 10) about MVC obtained during VATMS (in N), amplitude of potentiated twitches at rest (expressed in N), MEPs measured during 10% MVC (expressed in % Mmax), VAPNS and VATMS plotted against time, before (PRE) and after the WAnT (0 min corresponds to the end of the WAnT), with the control treatment (circles) and with the iTBS treatment (squares); thin lines represent the standard error of the mean. The three thin gray vertical lines highlight differences in timing between measurements. Two way ANOVAs within subjects were applied and significant results are described on the right side of each curve. Stars correspond to a significant difference (one star: p < 0.05, two stars: p < 0.01 and three stars: p < 0.001) related to time effect. Daggers represent a treatment difference for a time point (p < 0.001).
