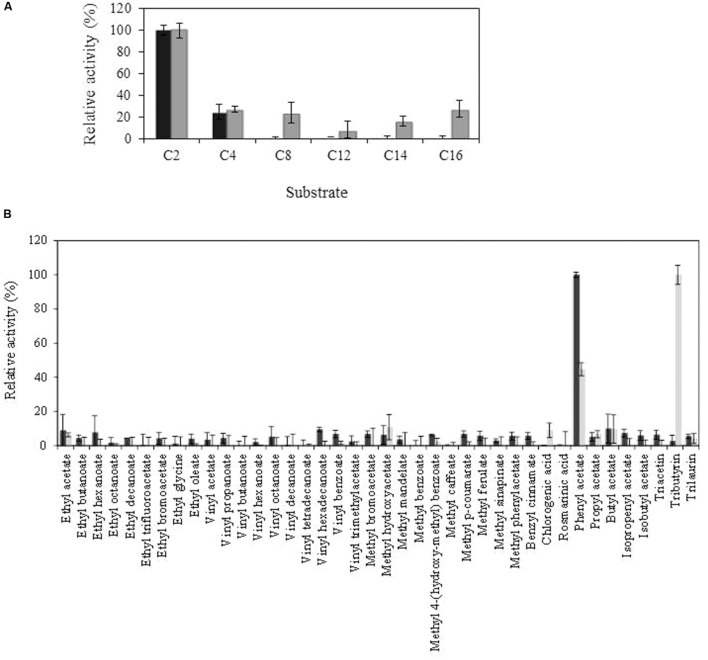
FIGURE 4.
Comparison of Lp_3561 and Lp_3562 substrate profile, against chromogenic substrates (p-nitrophenyl esters) with different acyl chain lengths (C2, acetate; C4, butyrate C8, caprylate; C12, laurate; C14, myristate; C16, palmitate) (A) or toward a general ester library (B). Lp_3561 is represented by black bars, and Lp_3562 by gray bars. The error bars represent the standard deviation estimated from the three independent assays. The observed maximum activity was defined as 100%.

