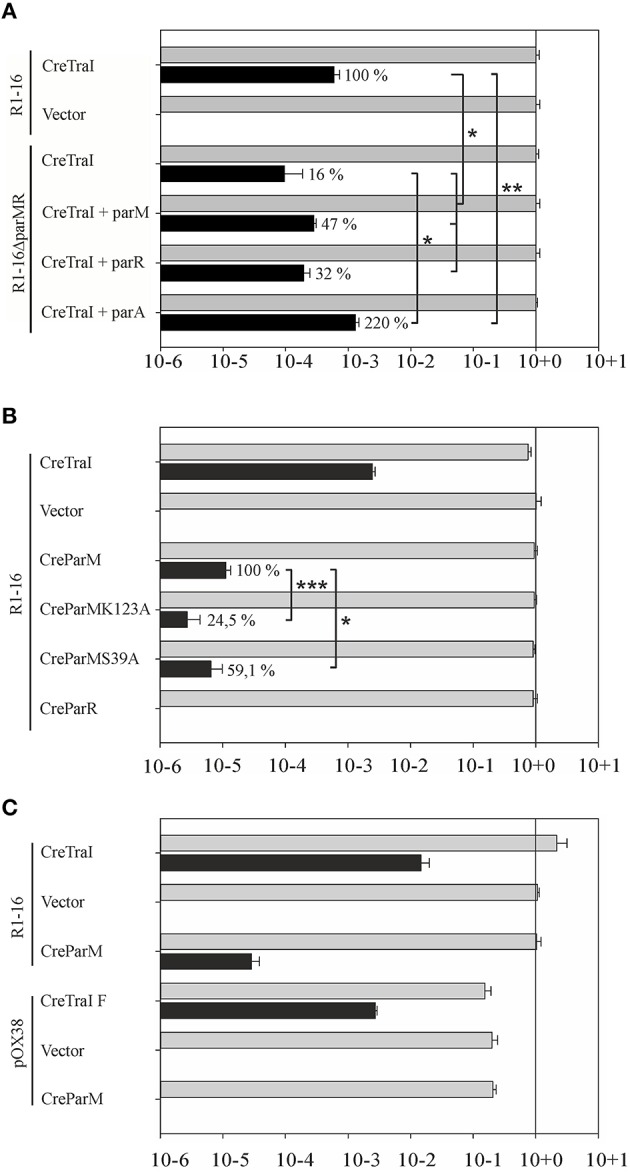
Figure 7.

Secretion of Cre-TraI and Cre-ParM to recipient cells. (A) Protein translocation was detected by recombination events per donor. The frequencies of protein transfer (black bars) were normalized to conjugation efficiency for each culture (gray bars). Relative differences in Cre-TraI transfer by R1-16 par mutant derivatives compared to wild type (100%) are indicated. Empty complementation vector pMS119EH was used as a control. (B) Frequencies of translocation of the indicated Cre-fusion proteins (left) by wild type R1-16 are shown with black bars. Percent of Cre-ParM transfer observed with mutant ParM variants compared to wild type ParM (100%) is indicated. (C) F transfer proteins expressed by pOX38 mediate DNA transfer (gray bars) and translocation of the F TraI protein fused to Cre, but not Cre-ParMR1. Standard deviations are shown, n = 3, significance was determined using a onesided t-test, *P < 0.05; **P < 0.05; ***P < 0.005.
