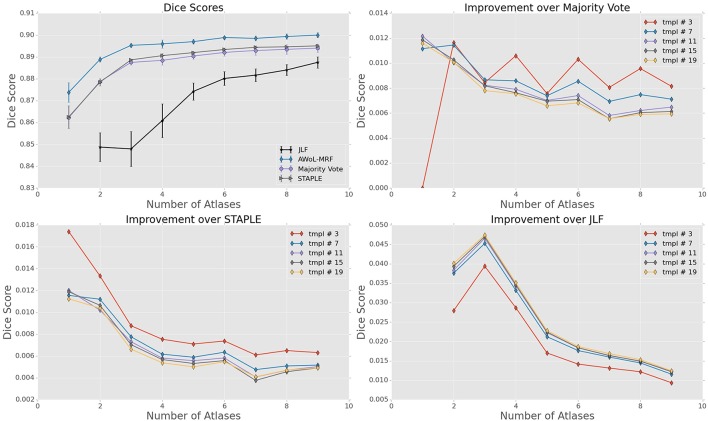
Figure 6.
Experiment II DSC: All results show the average performance values of left and right hippocampi over three-fold validation. The top-left subplot shows mean DSC score performance of all the methods. Remaining subplots show the mean DSC score improvement over compared methods for different number of templates (bootstrapping parameter of MAGeT-Brain).

