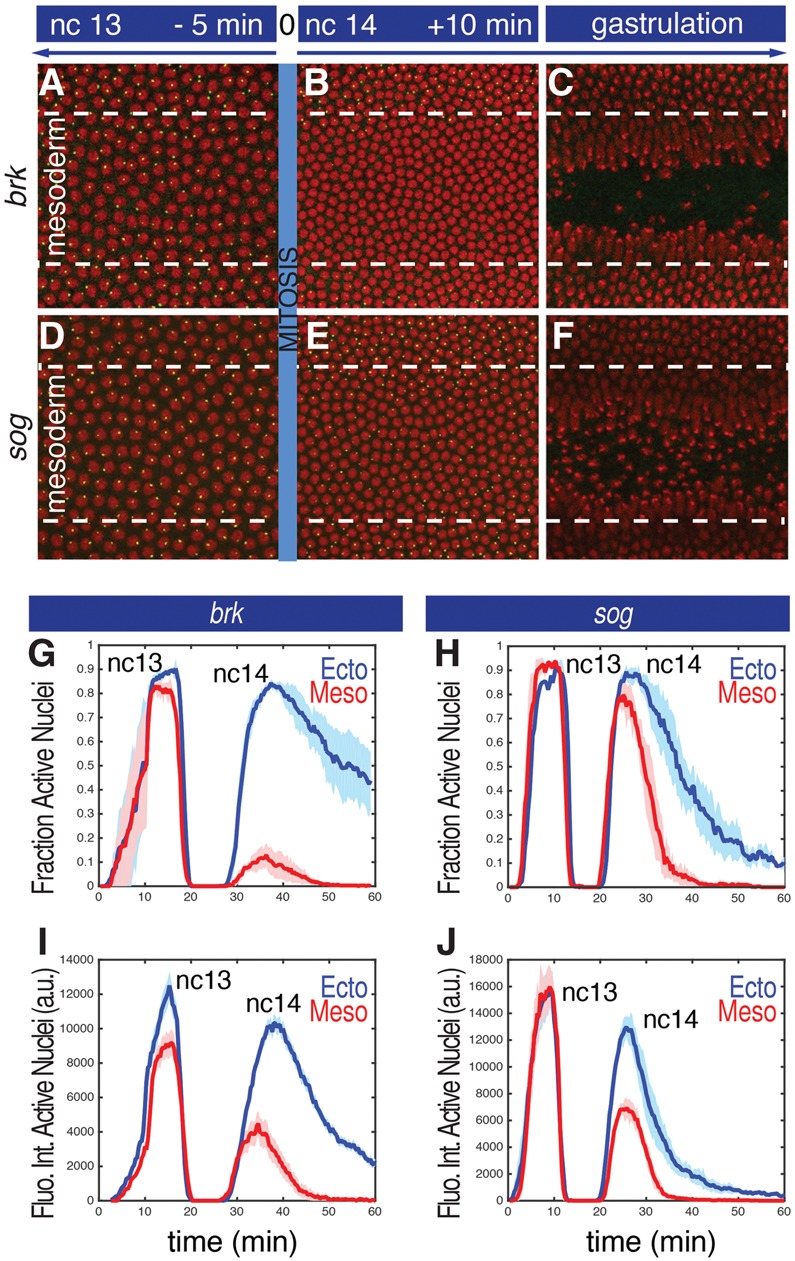
Figure 1.

Visualization of transcriptional repression in the mesoderm. (A–F) Projected confocal stacks of a live embryo at three different time points during nc13 and nc14 expressing brk>MS2 (A–C) or sog>MS2 (D–F). Green dots correspond to nascent transcripts visualized with an MCP::GFP fusion protein. Histone-RFP was used to visualize the nuclei (red). The presumptive mesoderm encompasses the nuclei included between dashed lines and corresponds to the region that invaginates at the onset of gastrulation. (G,H) The fraction of nuclei that display nascent RNA signals during a 1-h interval encompassing nc13, mitosis, and the first half of nc14. (Blue) Ectoderm nuclei; (red) mesoderm nuclei. Mean values from three biological replicate embryos are represented by the continuous line. The shaded area corresponds to the standard error of the mean (SEM) of three biological replicates. (I–J) Mean fluorescence intensities in active nuclei. (Blue) Ectoderm; (red) mesoderm. The shaded areas correspond to the SEM of three biological replicate embryos. The times above each panel in A–C are scaled to the general silencing that occurs at mitosis (time = 0).
