Figure 2.

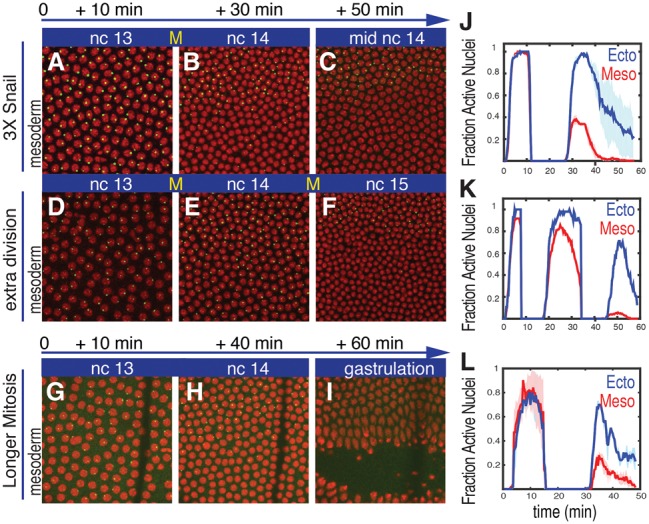
Increasing doses of Snail augments repression of sog>MS2. Projected confocal stacks of live embryos at three different time points during nc13 and nc14 expressing sog>MS2 and visualized with a MCP::GFP fusion protein (green). (A–C) Normal embryo containing three copies of snail due to an ∼25-kb snail BAC transgene. This embryo exhibits more immediate repression of sog>MS2 at the onset of nc14 as compared with the wild-type control (cf. B and Fig. 1E). (D–F) An embryo exhibiting an additional nuclear cycle. There is a substantial loss of sog>MS2 expression in the mesoderm at the onset of the final cell cycle (nc15). (G–I) A wild-type embryo where mitosis occurs at 17°C rather than room temperature. The line near the right of each panel corresponds to a glue line used to immobilize the embryo within the microfluidic chamber. Histone-RFP was used to visualize the nuclei (red). The times indicated above each panel are scaled to the general silencing that occurs at mitosis. (J–L) The fraction of nuclei that displays nascent transcripts in embryos carrying three copies of snail (J), undergoing an extra nuclear division (K), or undergoing extended mitosis (L). The shaded area in J and L corresponds to the SEM of two biological replicate embryos.
