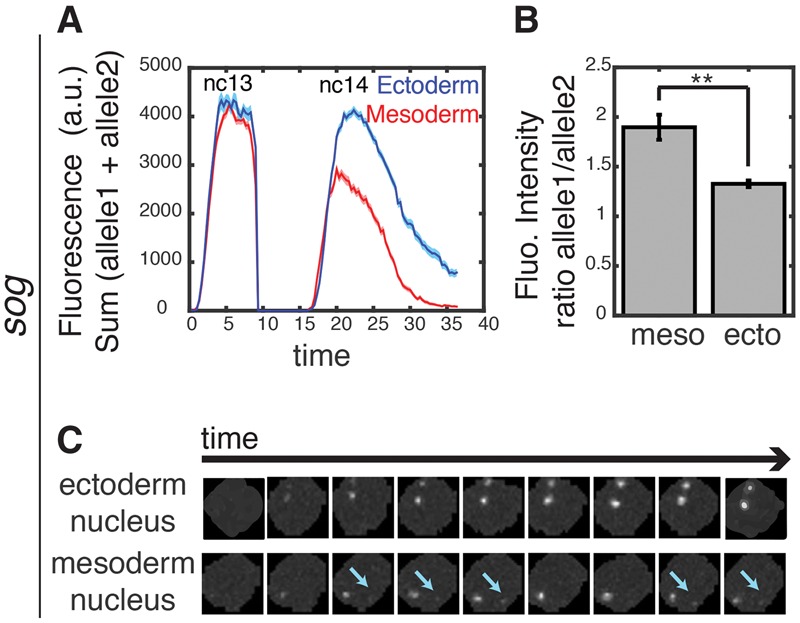
Figure 3.

Asymmetric repression of sog>MS2. Mean fluorescence intensities in active nuclei (sum of allele 1 and allele 2 intensity, where allele 1 is defined as the one with the higher expression level). (Blue) Ectoderm; (red) mesoderm. The shaded areas correspond to the SEM of two biological replicates. (B) The sog>MS2 transgene exhibits the asymmetric activities of homologous chromosomes. The ratio of transcriptional activity between the two alleles in ∼30 nuclei in the mesoderm and ∼30 nuclei in the ectoderm. (**) P-value < 0.02. Allele 1 is defined as the one with the higher expression level, and allele 2 is an allele with a lower expression level. (C) Raw snapshots of a nucleus with two active alleles in the ectoderm and mesoderm for the sog>MS2 transgene. Cyan arrows indicate the second (weak) allele in the nucleus.
