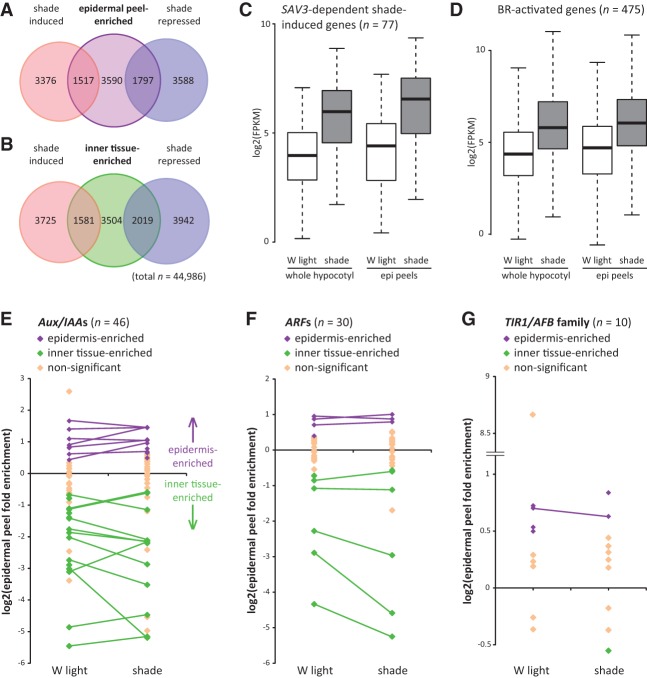
Figure 5.
Shade increases the expression of auxin and BR target genes in the hypocotyl epidermis of Brassica plants. (A) Overlap of genes with epidermal peel-enriched expression (in either white [W] light or shade) with shade-induced and shade-repressed genes in epidermal peel samples. Tissue was collected from 4-d-old white light-grown Brassica seedlings treated with 9 h of white light or shade. Gene expression was measured by RNA-seq. (B) Overlap of genes expressed at higher levels in the whole hypocotyl tissue relative to epidermal peels (referred to here as “inner tissue-enriched genes”) with shade-induced and shade-repressed genes in whole hypocotyl tissue samples. In A and B, all overlapping regions are significant. P < 0.005, one-sided Fisher's exact tests. (C) Of 174 putative orthologs of SAV3-dependent shade-induced genes (Li et al. 2012), 77 were significantly induced by shade in both epidermal peel and whole hypocotyl tissue. Box plot shows expression values for these genes. (D) Of 1702 putative orthologs of BR-activated genes (Sun et al. 2010), 475 were significantly induced by shade in both epidermal peels and whole hypocotyl tissue. The box plot shows the expression values for these genes. Twenty-nine of these genes are also represented in C. (E–G) Fold enrichment of gene expression in epidermal peels compared with whole hypocotyl tissue for white light and shade treatments for putative orthologs of Aux/IAA (E), ARF (F), and TIR1/AFB (G) family members. Only genes with fragments per kilobase per million mapped fragments (FPKM) > 0 in all sample types are shown. Purple and green diamonds indicate expression values in epidermal peels that are significantly different from whole hypocotyl tissue (false discovery rate, q < 0.05). Purple indicates epidermis-enriched, and green indicates inner tissue-enriched. Lines connect genes that have significantly enriched expression in either the epidermis or inner tissues in both light conditions.

