Figure 6.
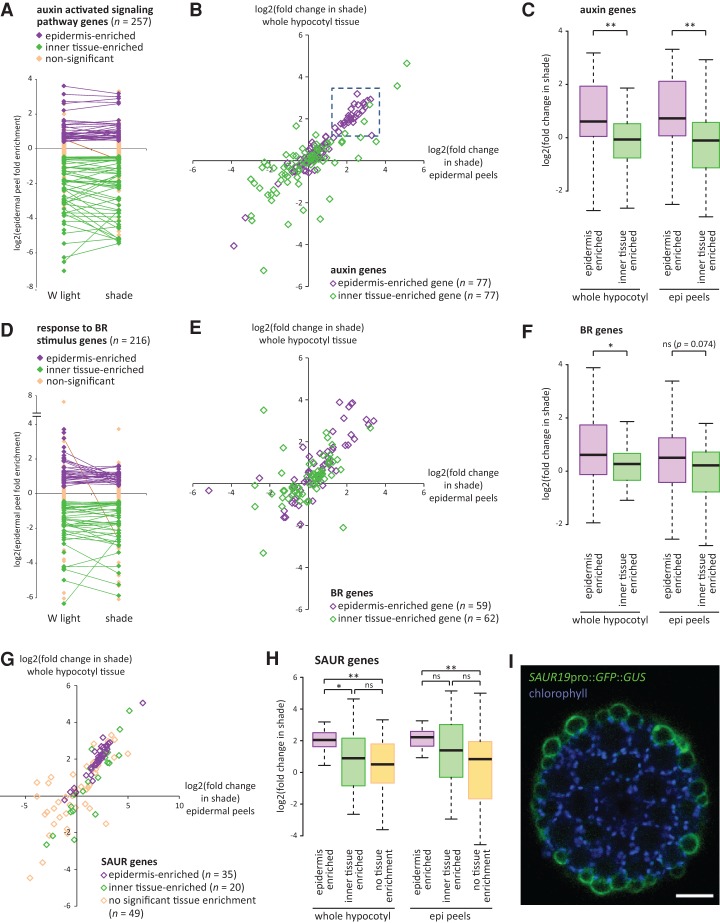
The Brassica epidermis is enriched for expression of auxin and BR target genes with high sensitivity to 9 h of shade treatment. (A) Fold enrichment of gene expression in Brassica epidermal peels compared with whole hypocotyl tissue in white (W) light-treated and shade-treated seedlings for genes associated with the GO term “auxin-activated signaling pathway.” Purple and green diamonds indicate expression values in epidermal peels that are significantly different from whole hypocotyl tissue (false discovery rate, q < 0.05). Purple indicates epidermis-enriched, and green indicates inner tissue-enriched. Lines connect genes that have significantly enriched expression in either the epidermis or inner tissues in both light conditions. Note that most genes do not change the tissue type of enrichment. Only those genes with FPKM > 0 in all sample types are shown. (B) Fold change in shade of gene expression in whole hypocotyl tissue (Y-axis) plotted against fold change in epidermal peel samples (X-axis). “Auxin-activated signaling pathway” genes that are significantly enriched in either the epidermis or inner tissues (in either white light or shade) are shown. The boxed region represents a cluster of 29 epidermis-enriched genes highly induced by shade. (C) Box plot of genes shown in B, showing fold change in shade. Note that the epidermis-enriched genes are more sensitive to shade. (**) P < 0.005; (*) P < 0.05; (ns) not significant, Student's t-test. (D–F) Same as in A–C, except showing genes associated with the GO term “response to BR stimulus.” (G,H) Same as in B and C except showing SAUR family genes. Genes with FPKM > 0 in all samples but that are not enriched in any particular tissue type are also shown. In H, comparisons are Tukey's HSD. (I) Hypocotyl cross-section of a 6-d-old Arabidopsis seedling showing GFP localization (green) in a SAUR19pro::GFP::GUS plant. Chlorophyll autofluorescence (blue) shows the position of the cortical cells. Note the strong GFP localization to the epidermis. Bar, 50 µm.

