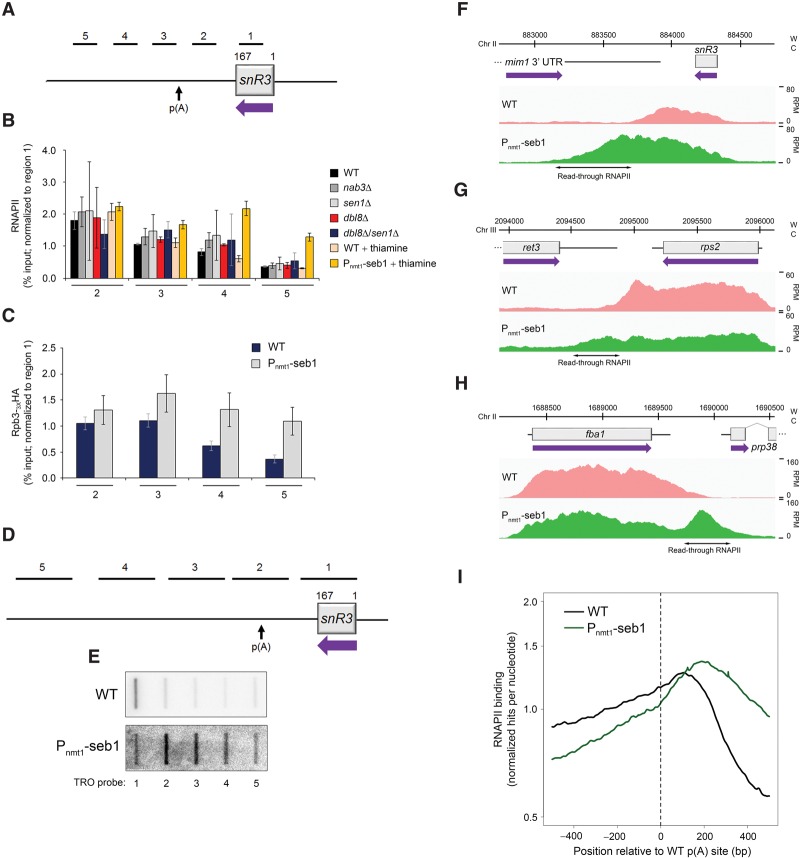
Figure 1.
Transcription termination defects in Seb1-depleted cells. (A) Schematic of the snR3 snoRNA locus. Bars above the gene show the positions of PCR products used for ChIP analyses in B and C. p(A) refers to the poly(A) site of the 3′ extended precursor (Lemay et al. 2010). (B) ChIP analyses of RNAPII density along the snR3 gene using extracts prepared from wild-type and the indicated mutant strains. ChIP signals (percent input) were normalized to region 1. Error bars indicate SD. n = 3 biological replicates from independent cell cultures. (C) ChIP analyses of HA-tagged Rpb3 (Rpb3-3XHA) along the snR3 gene in Seb1-depleted cells (Pnmt1-seb1) or control (wild-type) cells. Error bars indicate SD. n = 3 biological replicates from independent cell cultures. (D) Schematic showing the position of probes (1–5) used for TRO assays along the snR3 snoRNA locus. (E) Representative TRO blot for snR3. (F–H) RNAPII profiles (ChIP-seq) across the snR3 (F), rps2 (G), and fba1 (H) genes for the indicated strains. (W) Watson strand; (C) Crick strand; (RPM) reads per million. (I) Cumulative RNAPII profile relative to poly(A) sites in the indicated strains. Curves show the sum of normalized ChIP-seq sequencing scores over a genomic region covering the major poly(A) site.

