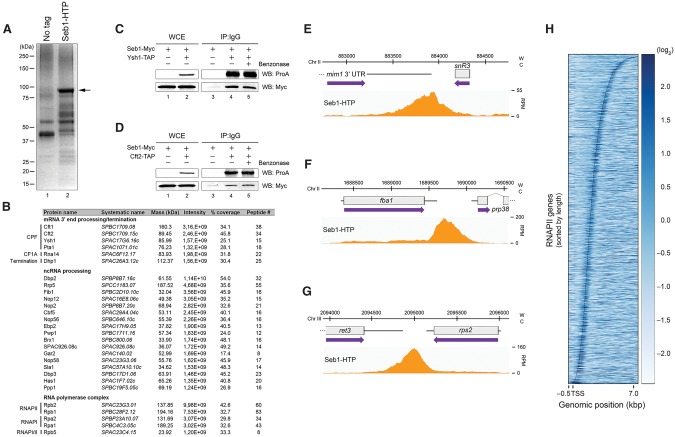
Figure 2.
Seb1 interacts with the 3′ end processing machinery and is enriched at the 3′ ends of genes. (A) Coomassie blue staining of proteins copurified with Seb1-HTP (lane 2) and from a control untagged strain (lane 1). The arrow indicates the position of Seb1-HTP. (B) A subset of the top 10% of Seb1-associated proteins identified by liquid chromatography-tandem mass spectrometry (LC-MS/MS) is shown. The intensity represents the relative abundance (peptide intensity), while the percentage of coverage and the peptide number represent the unique peptide sequence coverage and the number of unique peptides, respectively. (C,D) Immunoblot analyses of whole-cell extracts (WCE) (lanes 1,2) and IgG-sepharose precipitates ([IP] IgG) (lanes 3–5) prepared from control Seb1-Myc cells or Seb1-Myc cells coexpressing a TAP tag version of Ysh1 (C) or Cft2 (D). (Lanes 4,5) Purification experiments were performed in the absence or presence of the benzonase nuclease. (E–G) ChIP-seq analysis of Seb1-HTP occupancy along the snR3 (E), fba1 (F), and rps2 (G) genes. (W) Watson strand; (C) Crick strand; (RPM) reads per million. (H) Heat map of Seb1 DNA-binding sites derived from ChIP-seq for all RNAPII transcribed genes. Genes were sorted by length and aligned at their transcription start sites (TSSs). The curved line represents the poly(A) sites. Strength of binding is coded from white (no binding) to dark blue (strong binding).

