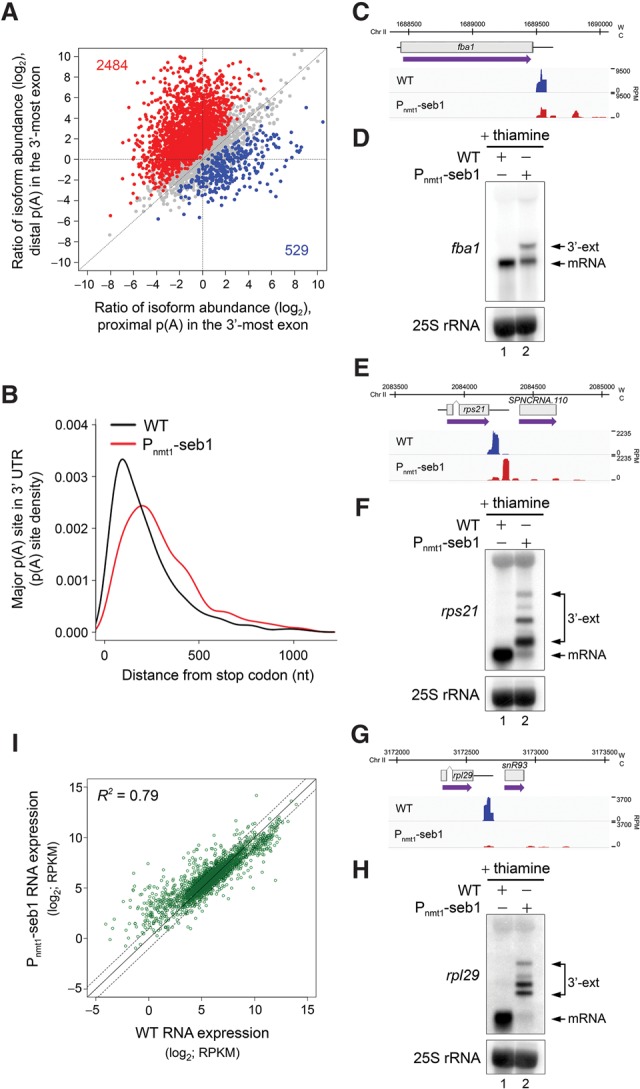
Figure 3.

Seb1 levels affect poly(A) site selection. (A) Regulation of APA site utilization in the 3′-most exon as determined by 3'READS. The number of genes with a significantly lengthened 3′ UTR (red dots) and the number of genes with a significantly shortened 3′ UTR (blue dots) are indicated in the graph. Significantly regulated isoforms are those with a P-value of <0.05 (Fisher's exact test). Only the two most abundant isoforms for each gene were analyzed. (B) Distribution of 3'READS-derived poly(A) sites relative to the upstream stop codon. The major poly(A) site is the one with the highest number of reads per gene. Mapped poly(A) sites in Seb1-depleted cells, as compared with wild-type cells, are, on average, significantly more distant from the stop codon. P-value < 2.22−16 by Wilcoxon rank-sum test. (C–H) 3'READS profiles and Northern blot analyses of fba1 (C,D), rps21 (E,F), and rpl29 (G,H) genes in the indicated strains. (W) Watson strand; (C) Crick strand; (RPM) reads per million. 3′ extended transcripts that accumulate in the Seb1-depleted condition are shown (3′-ext). (I) RNA expression changes for transcripts with 3’ extended 3′ UTRs in wild-type and Seb1-depleted cells as measured by RNA-seq. (RPKM) Reads per kilobase per million. The coefficient of determination (R2) is indicated.
