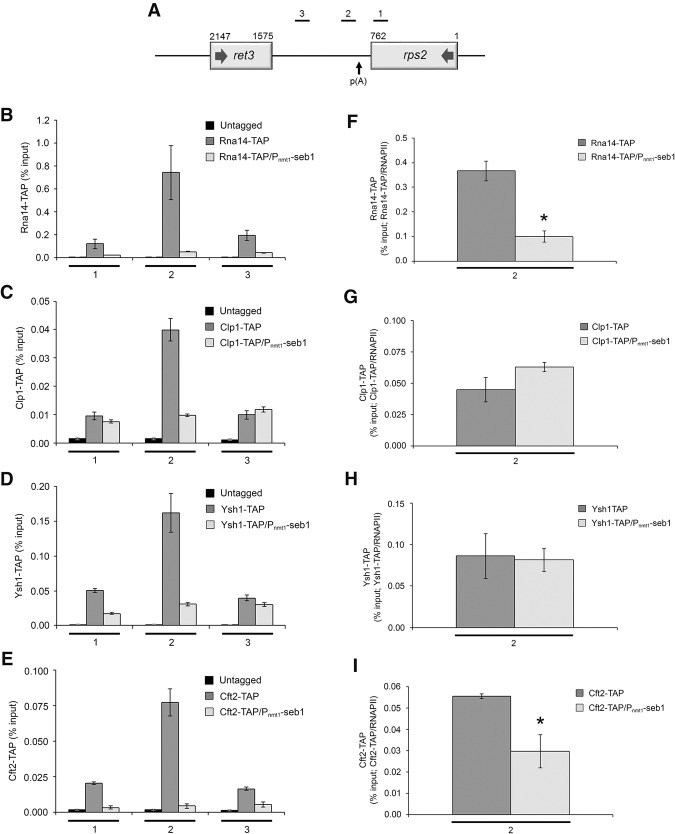
Figure 6.
Seb1 levels affect the cotranscriptional assembly of the cleavage/poly(A) machinery. (A) Bars above the rps2 gene show the positions of PCR products used for ChIP analyses. (B–E) ChIP assays of TAP-tagged versions of Rna14 (B), Clp1 (C), Ysh1 (D), and Cft2 (E) in wild-type and Seb1-depleted cells (Pnmt1-seb1). An untagged control strain was used to monitor the background signal of the ChIP assays. (F–I) Recruitment of 3′ end processing factors as a ratio of total RNAPII at the 3′ end of rps2 (region 2). ChIP signal of TAP-tagged 3′ end processing factors was divided by the total RNAPII signal at region 2. Region 2 was analyzed because it represents the location of maximal 3′ end processing factor recruitment. Error bars indicate SD. n = 3 biological replicates from independent cell cultures. (*) P < 0.05, Student's t-test.

