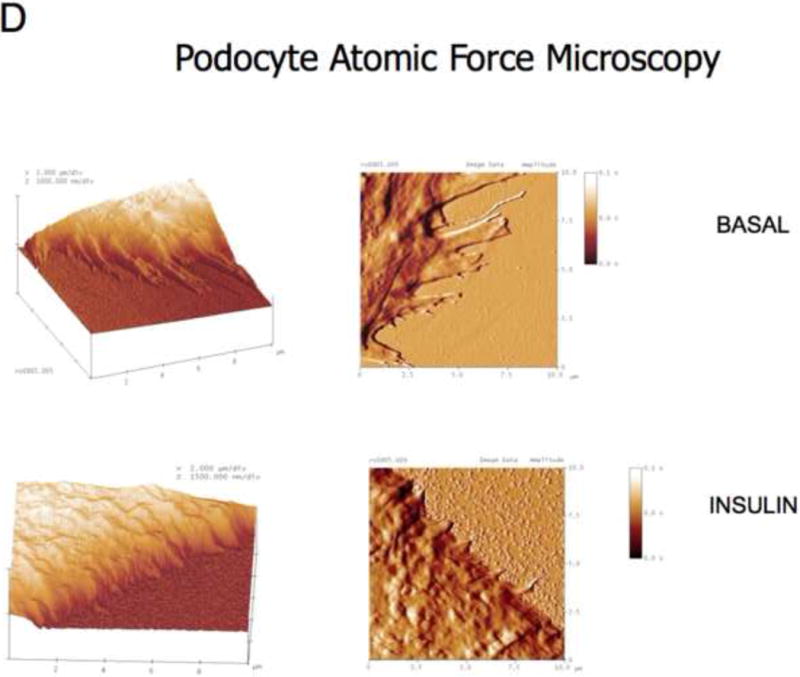
Figure 5. Insulin directly remodels the actin cytoskeleton of podocytes.


A. Immortalized human podocytes and GEnC were insulin stimulated (100nM) for 15 minutes and their F-actin cytoskeleton analyzed with phalloidin staining. Podocytes cortically reorganized (arrowed) their cytoskeleton and this did not occur in GEnC.
B. Insulin receptor knock down (IRKD) immortalized podocytes do not remodel their F-actin cytoskelton in response to insulin (phalloidin staining).
C. Objective computer assisted analysis with the in cell analyzer showed a dose response in insulin stimulated actin reorganization in Wild type podocytes which was statistically significant from 6.25nM. (ANOVA p<0.001 bonferonni *p<0.05 **p<0.001 compared with (cw) baseline n=8. Mean+/− SEM). This did not occur in the IRKD treated podocytes.
D. Atomic force microscopy representative of 4 independent experiments. Insulin causes retraction of cell processes. Insulin applied for 15 minutes.
E. Cell motility is increased in podocytes given insulin but not with IGF-1. Number of cells per unit area was significantly higher in insulin treated group 15 hours after insulin stimulation. This did not occur in IGF-1 treatment. (n=4 ** p< 0.01. Mean +/− SEM shown)
F. Electrical resistance is lost across podocyte monolayers within 5 minutes of insulin stimulation but returns to baseline by 30 minutes using ECIS analysis. ANOVA post hoc Bonferroni *p<0.05 ** p<0.01. No effect observed in GEnC treated in the same manner (n=12). Mean+/− SEM shown.
G. Insulin activates RhoA by 5 minutes (*p=0.018) and inhibits CDC42 by 2 minutes (*p=0.02) of insulin stimulation. These are both back to baseline by 30 and 15 minutes respectively (n=4 each. Mean+/− SEM shown).
H. Differentiated human podocytes transfected with dominant negative constructs v Rho (c3 transferase) and CDC42 (N17CDC42). There is diminished insulin induced cortical actin reorganization in Rho dominant negatively treated cells. CDC42 dominant negative transfection resulted in a high proportion of cells being cortically organized in their basal state.
