Figure 4.

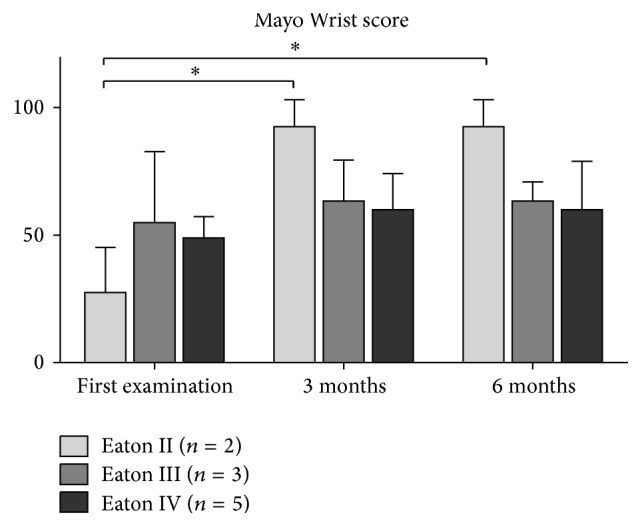
The course of the Mayo Wrist score depending on the severity of TMC OA. Data expressed as mean ± standard deviation. ∗ represents P < 0.05.

The course of the Mayo Wrist score depending on the severity of TMC OA. Data expressed as mean ± standard deviation. ∗ represents P < 0.05.