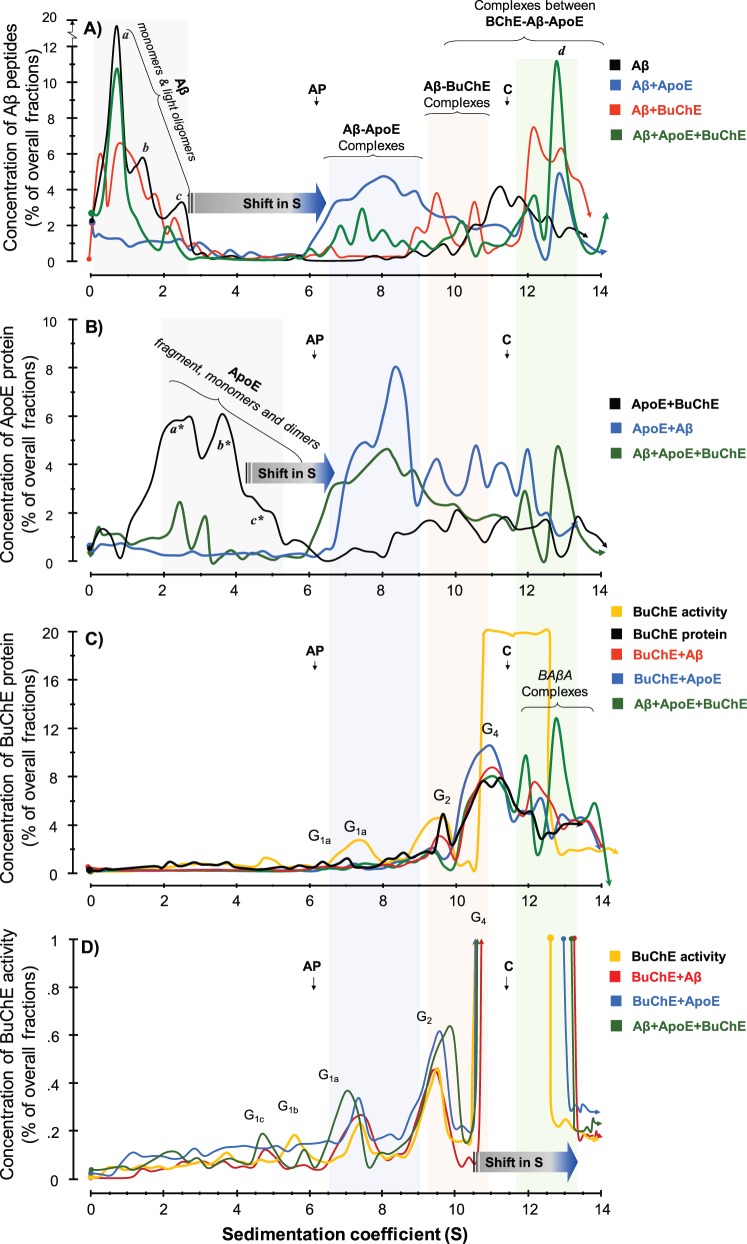
Figure 4.
SDG analyses of molecular interactions between recombinant amyloid-β peptides and purified human serum APOE and BuChE proteins. The molecular interactions between recombinant human amyloid-β peptides alone or together with purified human APOE and/or BuChE were analysed using the SDG technique. These samples were those that had been recollected after ∼70 h of incubation from the wells of the microtitre plates at the end of the thioflavin T assay as is depicted in the schematic Supplementary Fig. 1 . Linear sucrose gradient solutions were prepared in ultracentrifuge tubes. Samples were then loaded on the top of the gradient, together with two enzymes, alkaline phosphatase (AP) and catalase ( C ) with known sedimentation coefficients (S) of 6.1 and 11.4, respectively, as indicated by the vertical arrows in the SDG diagrams. These two enzymes also served as irrelevant control proteins for the interaction between amyloid-β, APOE and BuChE proteins. After overnight ultracentrifugation, the content of each SDG tube was carefully fractionated into ∼50 equal fractions from the bottom of the tubes, and the levels of amyloid-β, APOE and BuChE were quantified in all fractions, as described in the ‘Material and methods section. ( A ) Presence and relative levels of amyloid-β peptides in the fractions are plotted versus the corresponding S-values of the fractions. The denoted peaks a, b, and c from the SDG tube containing only amyloid-β (black line) exhibit S-values that closely correspond to the molecular weight of amyloid-β monomers (∼4 kDa), dimers (∼8 kDa) and tetramers or hexamers (∼16–24 kDa), respectively. In the presence of APOE protein (blue line), these peaks exhibit strong shifts in their S-values, indicating that all amyloid-β peptides were incorporated in stable amyloid-β-APOE complexes (the light blue-shaded area). In the presence of the BuChE protein (red line), the intensity of these amyloid-β peaks show partial reduction, while new amyloid-β peaks appear with much larger S-values, corresponding to stable amyloid-β-BuChE complexes (the light pink-shaded area). When both APOE and BuChE proteins were present (green line), the peaks’ intensities (relative levels) but not their S-values are altered, indicating competitive displacement of amyloid-β peptides between APOE and BuChE and/or rearrangements of the complexes. (B) Relative levels of APOE protein are plotted against S-values of the fractions. In the absence of amyloid-β peptides, the SDG procedure separated the purified serum APOE protein (black line) in three main peaks, corresponding to a major APOE fragment with ∼24 kDa (a*) and full-length monomers (b* ∼34 kDa) and dimers (c*∼68 kDa) of APOE. In the presence of amyloid-β (blue line), these peaks are completely shifted to the right, evincing that APOE is in complexes with amyloid-β, as was predicted in A (amyloid-β-APOE complexes as is highlighted by the light blue-shaded area). ( C and D ) Relative levels of purified serum BuChE protein ( C ) and activity ( D ) in the corresponding SDG fractions are plotted versus the S-values of the SDG fractions from the specified tubes. Similar to the amyloid-β and APOE SDG diagrams, BuChE-containing peaks show a shift in their S-value when amyloid-β (red line) or both amyloid-β and APOE (green line) were present compared to BuChE alone (orange line in C and D ). Note that in D , the y -axis is cut-off at 1% of overall SDG fractions from each tube to be able to illustrate the presence of lighter globular ( G ) forms of BuChE as the G4 BuChE and/or BuChE-amyloid-β-APOE (BAβA) complexes exhibited ∼99% of the overall BuChE in the fractions, although the relative protein levels of theses heavy BuChE containing peaks protein were ∼10–12% of the total fractions the light-pink and green shaded area in C , which is reasonably comparable with the relative levels of the G 1 (∼1%) or G 2 peaks (∼4%).

