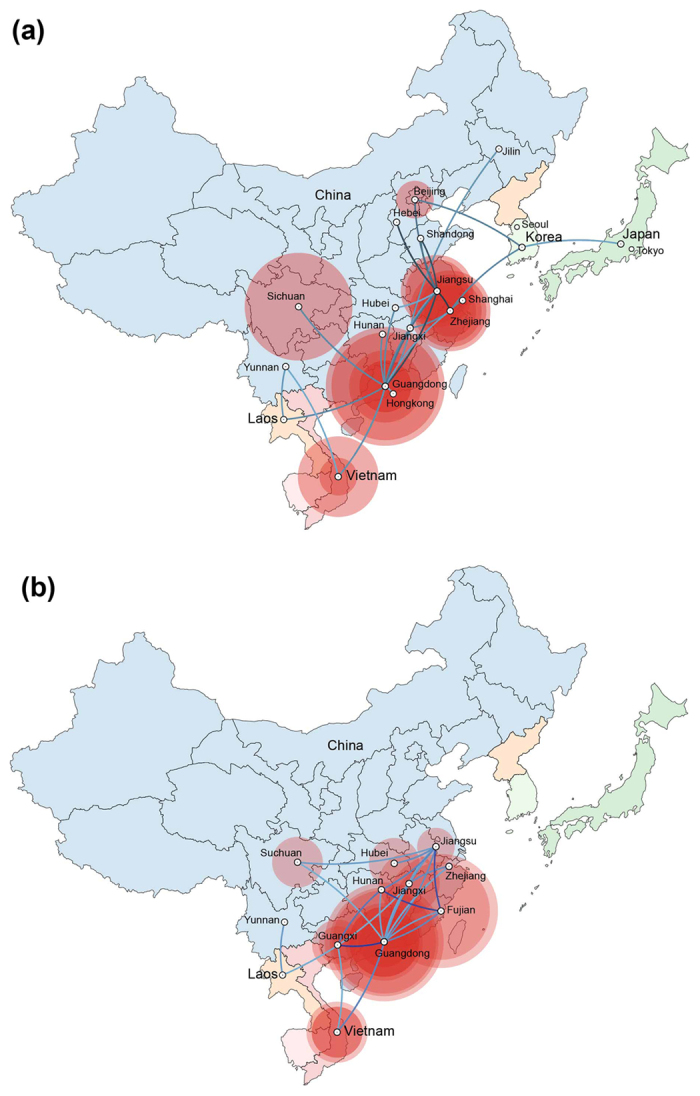
Figure 4.

Dispersal patterns of HA (a) and NA (b) segments. Lines between locations represent branches on the MCC tree and the colour gradient indicated the height of location. Circle diameters of locations are proportional to the square root of the MCC for the location at each time point. The colour gradient indicates the relative ages of the transitions (older–recent). The phylogeographic inferences of the HA and NA segments were analysed and visualized with the spatial phylogenetic reconstruction of evolutionary dynamics using data-driven documents (SpreaD3) v0.9.659.
