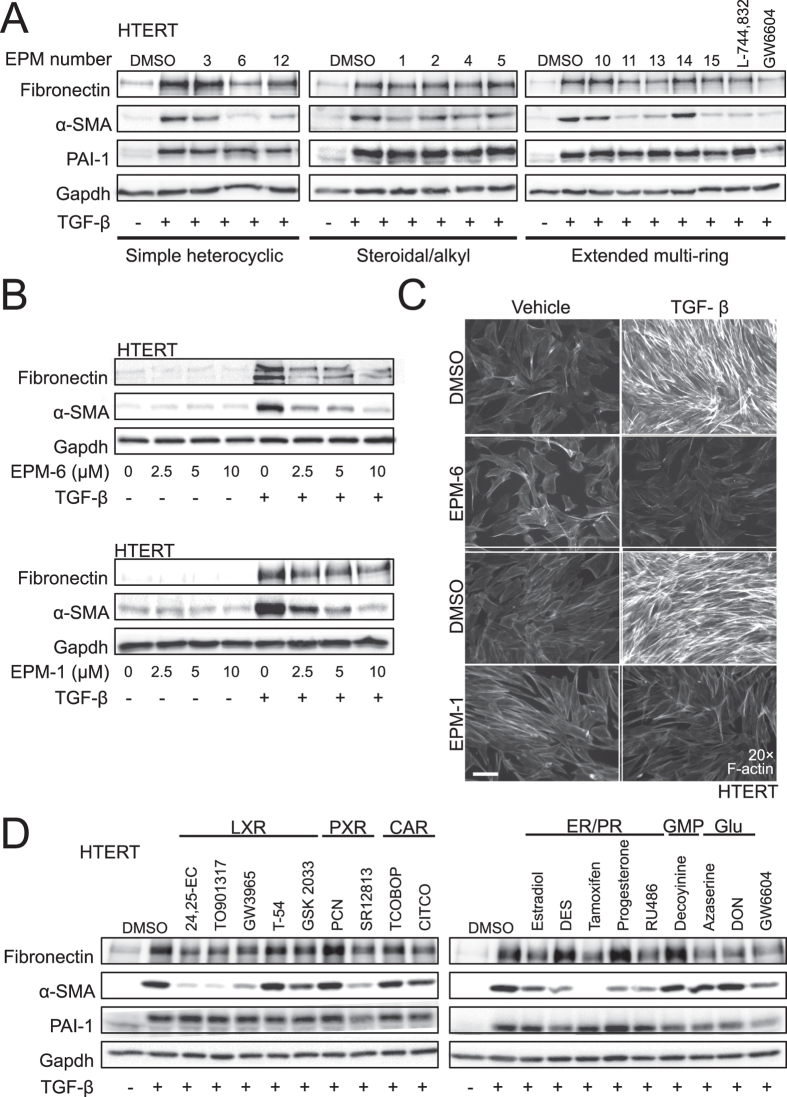
Figure 5. Analysis of 13 selected compounds in HTERT fibroblasts.
(A,B) Protein expression analysis in HTERT total cell lysates stimulated (+) or not (−) with 5 ng/ml TGF-β for 72 h and co-treated with (A) DMSO or specific EPMs (10 μM); (B) DMSO (0 μM) or EPM-6 and EPM-1 at the indicated concentrations. Immunoblots for the indicated proteins and for Gapdh, the protein loading control, are shown. (C) Actin microfilament direct fluorescence microscopy of HTERT cells stimulated with vehicle or 5 ng/ml TGF-β for 72 h in the presence of DMSO or 10 μM of EPM-6 and EPM-1. White bar indicates 10 μm. (D) Protein expression analysis in HTERT total cell lysates stimulated (+) or not (−) with 5 ng/ml TGF-β for 72 h and co-treated with DMSO or specific compounds (10 μM). Immunoblot for the indicated proteins and for Gapdh, the protein loading control, are shown.

