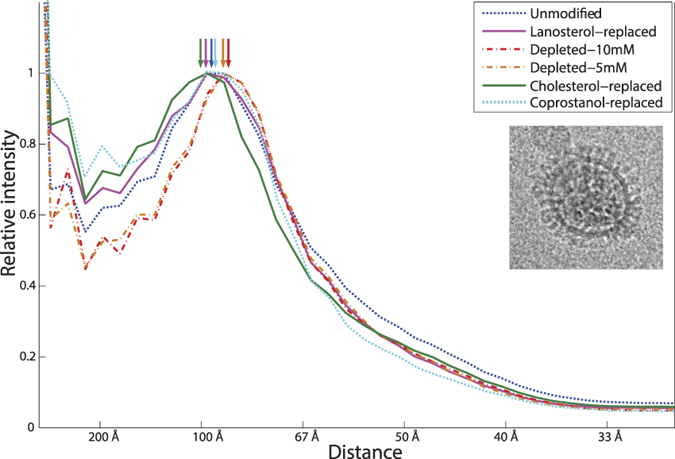
Figure 5. Hemagglutinin spatial distribution in lanosterol-replaced influenza virus is similar to cholesterol-replaced virus but not cholesterol-depleted virus.

Hemagglutinin spatial distribution is estimated from radially averaged 2D Fourier transforms of transmission electron micrographs. These approximate a pair correlation function of electron density. Prior experiments using anti-HA monoclonal Fabs32 have shown that the HA density can be assigned to the peak at ~100–85 Å, which agrees with previous estimates of influenza surface glycoprotein spacing41,42. This peak shifts laterally upon cholesterol depletion and back upon replenishment using either cholesterol, lanosterol, or coprostanol. The mode of the peak, indicating typical nearest-neighbor spacing of hemagglutinin on the viral envelope, is identical for cholesterol-replaced, lanosterol-replaced, and coprostanol-replaced virus at 97 Å. This analysis was performed in an identical fashion to our previous work, with difference being the use of sterols other than cholesterol. An electron micrograph of a lanosterol-replaced virion is shown in the inset.
