Figure 4.
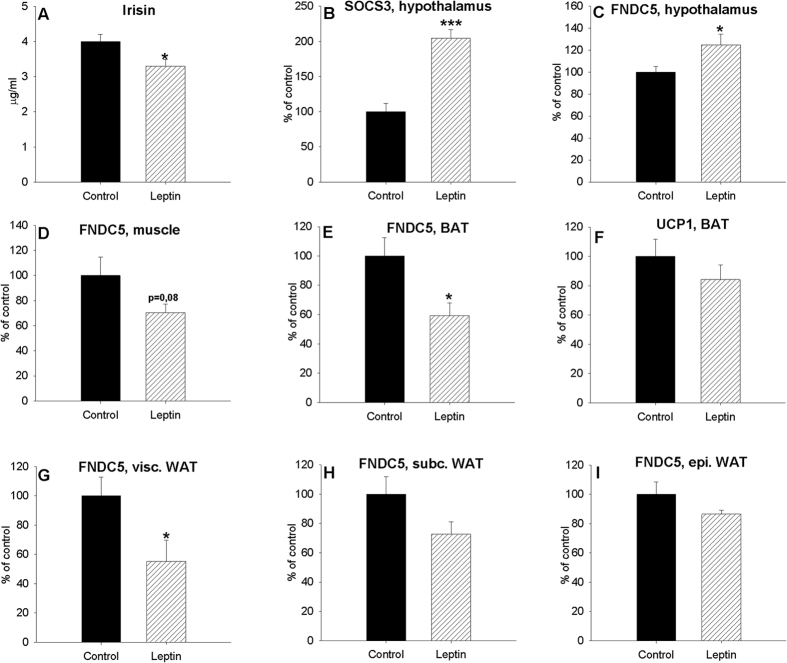
Effect of 2-day IP leptin treatment in fed animals on plasma irisin (A) levels, SOCS3 gene expression (B), FNDC5 expression levels in the hypothalamus (C), muscle (D), BAT (E) and visceral (G), subcutaneous (H) and epididymal (I) white adipose tissue of adult male rats and UCP1 expression levels in BAT (F). Values are expressed in μg/ml for circulating irisin and arbitrary units for FNDC5 and SOCS3 gene expression, as the mean ± SEM, where control = 100%. n = 6–7. *, ***P < 0.05 and 0.01 respectively vs. control (rats injected with saline) (t-test).

