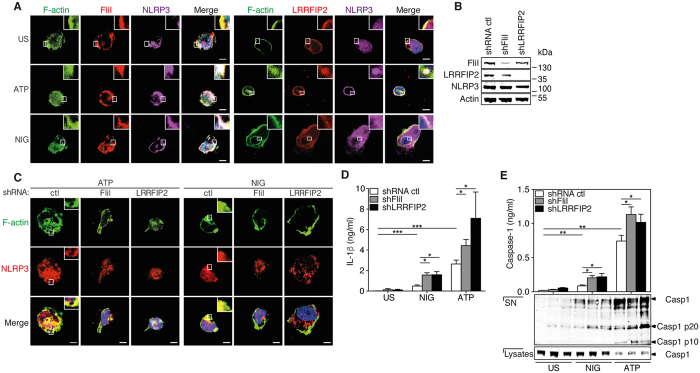
Figure 4. FliI and LRRFIP2 enable inhibition of NLRP3 inflammasome activity via co-localization with F-actin.
(A) Confocal microscopy of ATP- and nigericin-activated THP-1 cells. Blue, nuclei. Outlined areas are enlarged in top right corners. Scale bars, 10 μm. Representative pictures of 3 independent experiments. (B) Western blot analysis of FliI and LRRFIP2 expression in THP-1 cells stably transduced with lentivirus carrying FliI and LRRFIP2 shRNA. Data are representative of 3 independent experiments. (C) Confocal microscopy of ATP- and nigericin-activated THP-1 cells transduced with FliI and LRRFIP2 shRNA. Blue, nuclei. Outlined areas are enlarged in top right corners. Scale bars, 10 μm. Representative pictures of 3 independent experiments. (D) IL-1β production in culture supernatants of THP-1 cells transduced with FliI and LRRFIP2 shRNA and unstimulated or stimulated with ATP and nigericin. Data are means ± SEM of at least 3 independent. (E) Caspase-1 in supernatants (SN) of THP-1 cells treated as indicated and assessed by ELISA (upper panels) and Western blot (bottom panels); the presence of caspase-1 was assessed by Western blot into cells lysate. Data are represented as mean ± SEM of at least 3 independent experiments or representative of 3 independent experiments. Statistical significance was determined by Mann-Whitney U analysis. The cropped blots were run under the same experimental conditions. See Figure S3.

