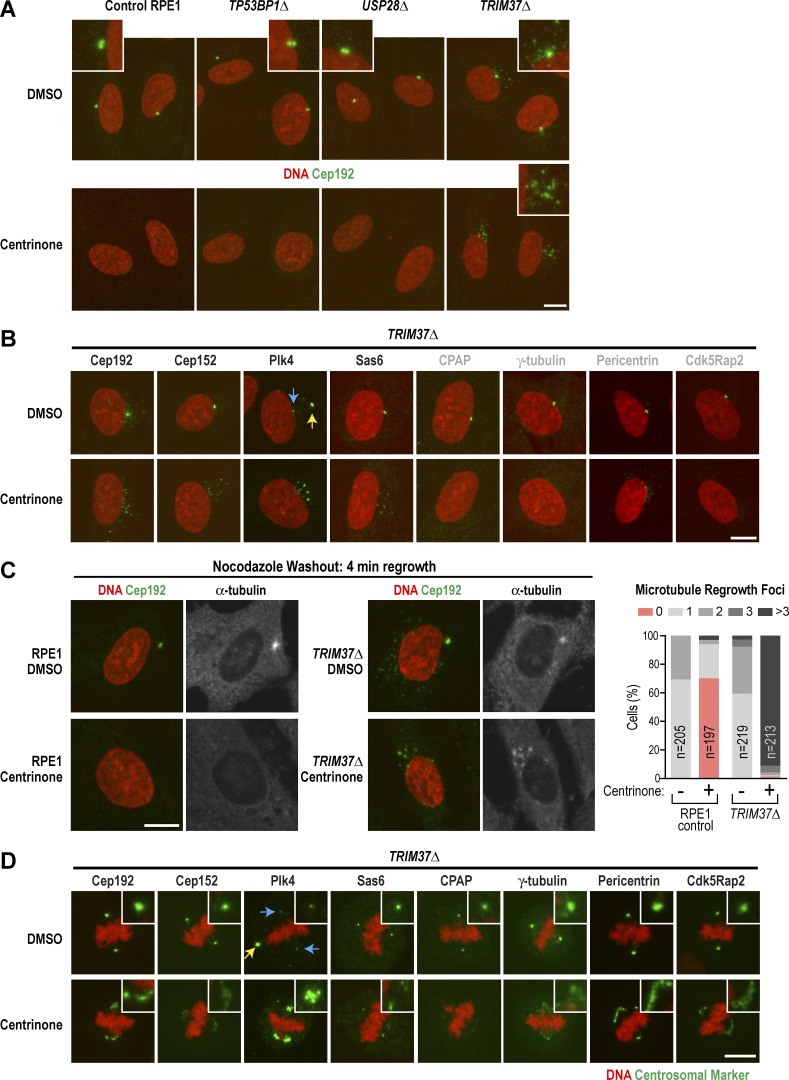
Figure 4.
TRIM37Δ cells form foci containing centrosomal markers. (A) Immunofluorescence images after 5-d treatment with DMSO (top row) or centrinone (bottom row). Cells were stained for DNA (red) and with antibodies to the centrosomal protein Cep192 (green; insets 2.5× magnified). (B) Immunofluorescence images of interphase TRIM37Δ cells stained for DNA (red) and with antibodies to the indicated centrosomal proteins (green) after 5-d treatment with DMSO (top) or centrinone (bottom). Images are representative, and each marker was equivalently scaled for the two conditions. Yellow arrow points to bright ectopic Plk4 focus; blue arrow points to centrioles. (C) Immunofluorescence images of a microtubule regrowth experiment. Control RPE1 (left) and TRIM37Δ (middle) cells were pretreated for 5 d with DMSO (top) or centrinone (bottom) followed by 2-h treatment with nocodazole to depolymerize microtubules. Microtubules were allowed to grow for 4 min after nocodazole washout before fixation. Graph shows quantification of microtubule regrowth foci. (D) Immunofluorescence images of mitotic TRIM37Δ cells stained for DNA (red) and with antibodies to the indicated centrosomal proteins (green) after 5-d treatment with DMSO (top) or centrinone (bottom). Each marker was equivalently scaled for the two conditions. Yellow arrow points to bright ectopic Plk4 focus; blue arrows point to centrioles. Bars, 10 µm.

