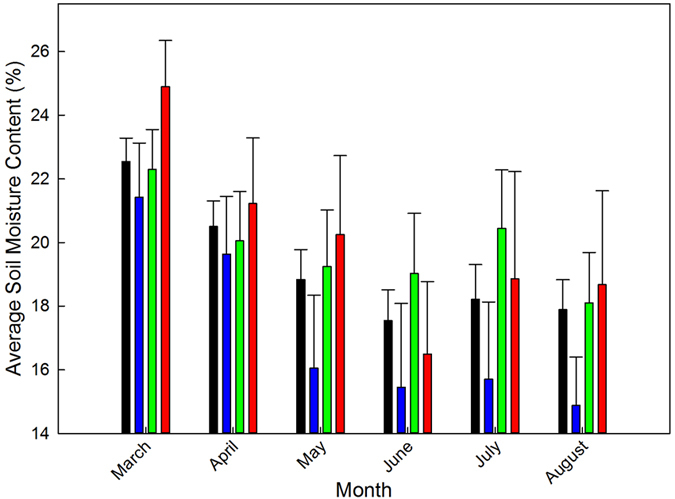
Figure 1. Month-specific soil moisture content (%) averaged across Blairsville, Tifton and Calhoun in GA (2003–2013) by ENSO phase.

Bars in black color represent the 11-year average soil moisture content. Bars in blue color represent the average soil moisture content of the La Niña years. Bars in green color represent the average soil moisture content of the Neutral years. Bars in red color represent the average soil moisture content of the El Niño years. Standard errors represent the standard error of the mean.
