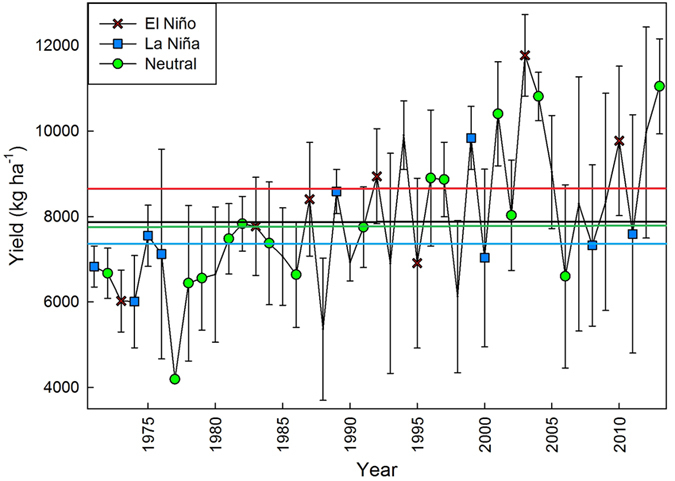
Figure 2. Year-specific maize yield (kg ha−1) from 1971–2013 averaged across the locations of the study.

Blue rectangles represent yields during La Niña ENSO years. Green circles represent yields during Neutral ENSO years. Red crosses represent yields during El Niño ENSO years. The horizontal black line represents the 43-year yield average (Yield = 7853 kg ha−1, s.e.m = 245 kg ha−1). The horizontal green line represents the Neutral ENSO years average yield (Yield = 7850 kg ha−1, s.e.m = 454 kg ha−1). The horizontal blue line represents the La Niña ENSO years average yield (Yield = 7543 kg ha−1, s.e.m = 367 kg ha−1). The horizontal red line represents the El Niño ENSO years average yield (Yield = 8515 kg ha−1, s.e.m = 719 kg ha−1). Standard errors represent the standard error of the mean.
