
Figure 3.
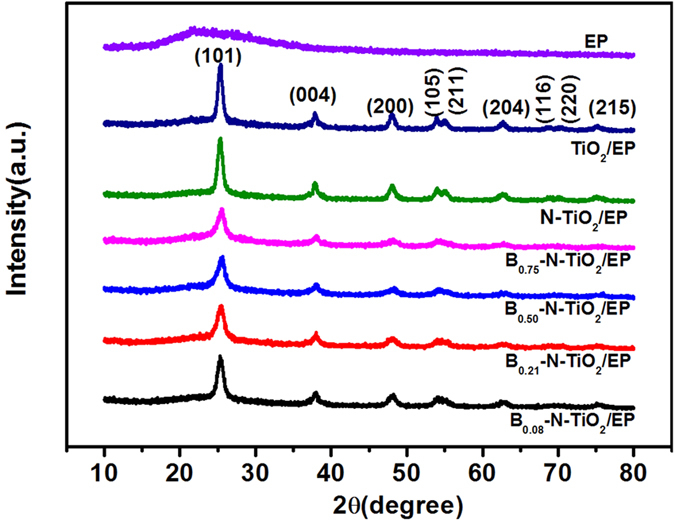
XRD patterns and corresponding diffraction peaks for (a) B0.08–N–TiO2/EP, (b) B0.21–N–TiO2/EP, (c) B0.51–N–TiO2/EP, (d) B0.75–N–TiO2/EP, (e) N–TiO2/EP, (f) TiO2/EP. The original EP serves as control.
Official websites use .gov
A
.gov website belongs to an official
government organization in the United States.
Secure .gov websites use HTTPS
A lock (
) or https:// means you've safely
connected to the .gov website. Share sensitive
information only on official, secure websites.
XRD patterns and corresponding diffraction peaks for (a) B0.08–N–TiO2/EP, (b) B0.21–N–TiO2/EP, (c) B0.51–N–TiO2/EP, (d) B0.75–N–TiO2/EP, (e) N–TiO2/EP, (f) TiO2/EP. The original EP serves as control.