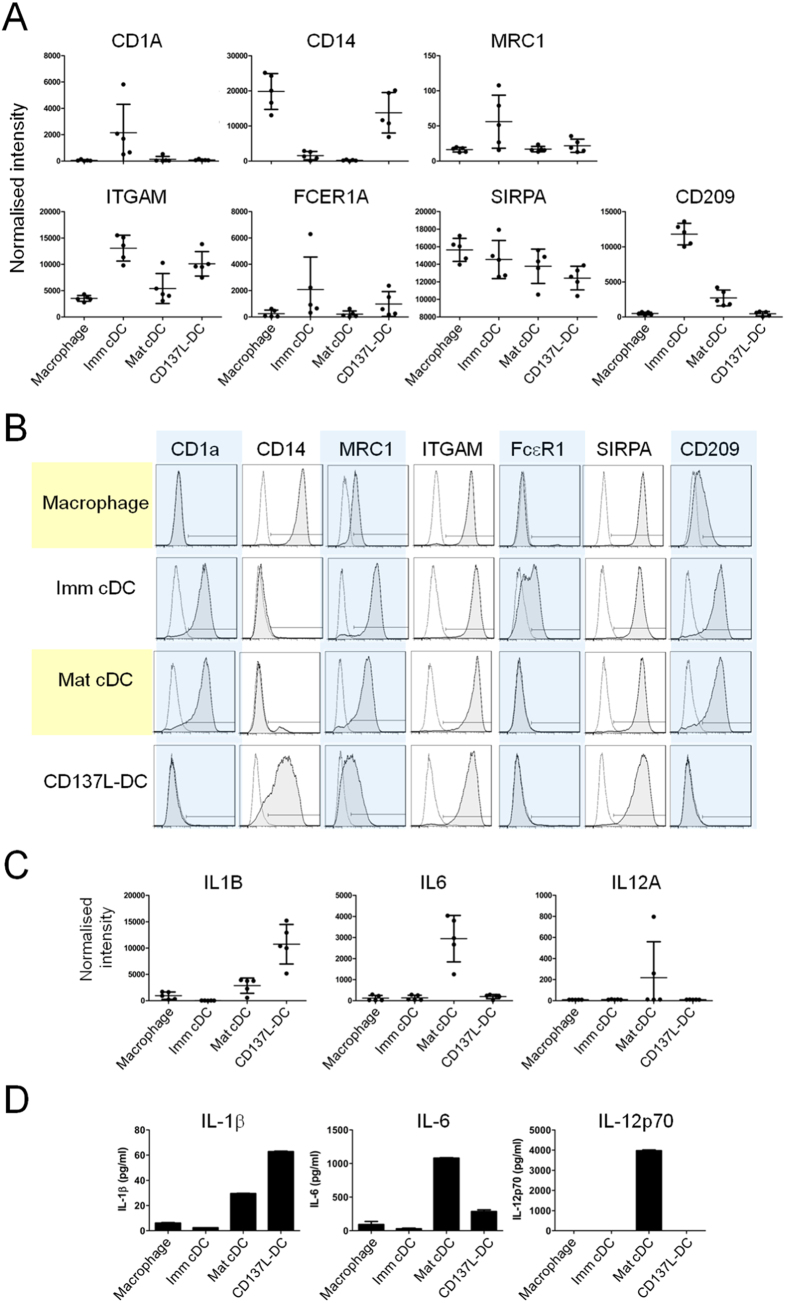
Figure 2. Validation of microarray data by protein expression analysis.
Expressions of surface markers and cytokine release were used to validate results from microarray. (A) Microarray analysis denoting expression of genes encoding for surface proteins CD1a, CD14, MRC1, ITGAM, FcγR1A, SIRPA, and CD209, together with their corresponding (B) surface protein expression on macrophages, imm cDCs, mat cDCs, and CD137L-DCs analysed by flow cytometry. Flow cytometry histograms are representative of 3 independent experiments with comparable results. (C) Expression of genes encoding for cytokines IL-1β, IL-6 and IL-12A (p35), together with their corresponding (D) cytokine release detected by ELISA. Note that gene IL12A encodes for the IL-12p35 protein which is a component of the active heterodimer IL-12p70. Depicted are means ± standard deviation of triplicate measurements from one representative of 3 independent experiments.

