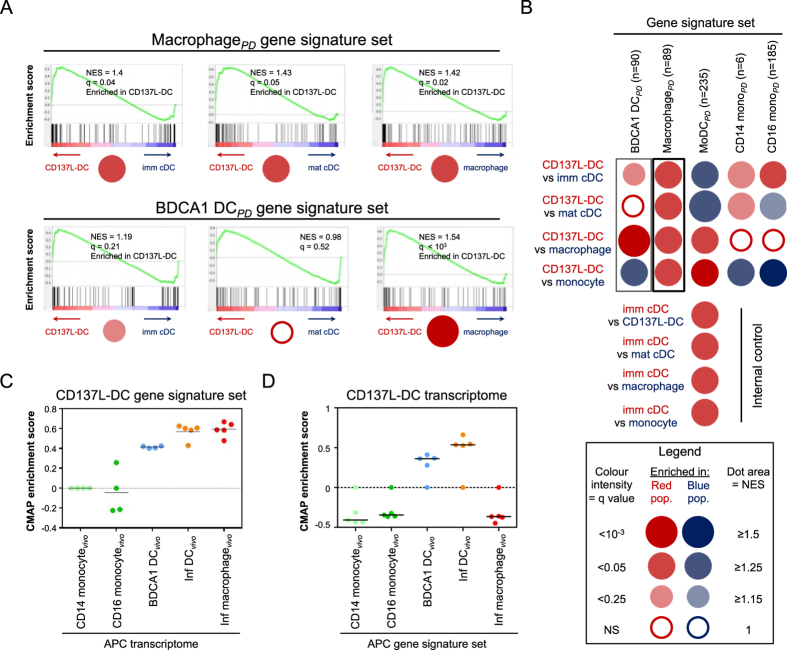
Figure 6. Gene set enrichment and connectivity map enrichment analyses of CD137L-DCs.
GSEA of the gene signature (Segura et al.35) of blood and tonsil BDCA1+ DC (BDCA1 DCPD), alveolar macrophages (macrophagePD), monocyte-derived DC (MoDCPD), blood CD14+ monocytes (CD14 monoPD), and blood CD16 monocytes (CD16 monoPD) was performed. GSEA results for pairwise comparisons of APC populations; imm cDCs, mat cDCs, macrophages, and monocytes with CD137L-DCs. (A) The GSEA output is represented as a bar code characterised by two parameters; the normalized enrichment score (NES) and the false discovery rate statistical value (q). Green curve refers to the calculation of enrichment score. (B) Dot blot representation of pairwise GSEA comparison between CD137L-DCs with all other APC populations; imm cDCs, mat cDCs, macrophages, and monocytes. Gene signature sets comprise of a different number of genes (n). The dot colour corresponds to the font colour of the population in which the gene signature set is enriched. The dot area is proportional to the NES while the colour intensity is indicative of the false discovery rate statistical q value. CD137L-DC signature genes (829 genes) were derived from the formulation as described in Figure S1 and were subjected to CMAP analysis and GSEA. (C) CMAP enrichment analysis using CD137L-DC signature genes on in vivo APC samples acquired by Segura et al.35. CD14+ monocytes were used as the reference sample. (D) CMAP enrichment analysis using signature genes from in vivo APC samples on complete CD137L-DC transcriptome.

