
Figure 1.
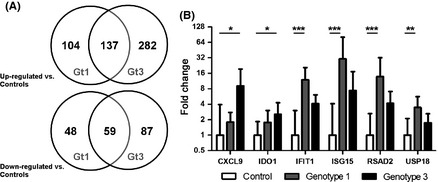
Transcriptional profiles of liver biopsies from HCV gt1‐ and gt3‐infected individuals compared with controls. (A) Significantly upregulated and downregulated genes (∆FPKM(log2) ≥1.0 and q‐value <0.05) in gt1‐ and gt3‐infected patients (each n = 5), versus controls (n = 4). (B) Validation by Q‐PCR (geometric mean with 95% confidence interval) in gt1‐infected patients (n = 9, except CXCL9 and IDO1 n = 6), gt3‐infected patients (n = 9) and controls (n = 6, except CXCL9 and IDO1 n = 4). * denotes P‐value <0.05, ** denotes P‐value <0.01, and *** denotes P‐value <0.001.