
Figure 2.
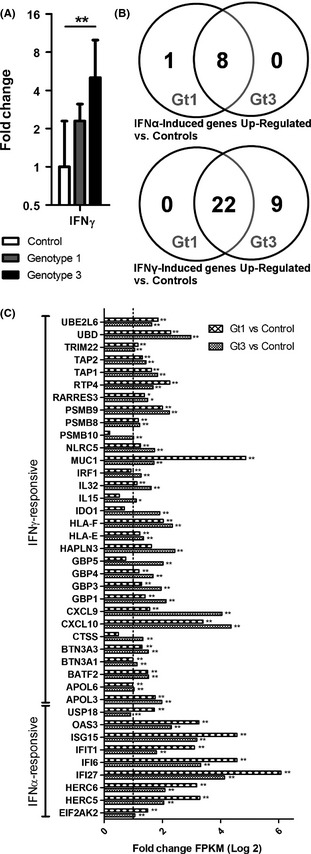
Type II IFN transcription and downstream gene induction are elevated in HCV gt3 infection. (A) IFNG mRNA levels (geometric mean with 95% confidence interval) in gt1‐infected patients (n = 9), gt3‐infected patients (n = 9) and controls (n = 6). ** denotes P‐value <0.01. (B) Preferentially IFN‐α‐ and IFN‐γ‐responsive genes identified in HuH‐7 and HepaRG cells and upregulated in liver biopsies from either gt1‐ (n = 5) or gt3‐infected patients (n = 5), versus controls (n = 4). (C) Fold change of preferentially IFN‐α‐ and IFN‐γ‐regulated genes in gt1‐ and gt3‐infected liver biopsies versus control liver biopsies. The dotted line represents the ∆FPKM(log2) ≥1.0 cut‐off used to select differentially regulated genes. * denotes q‐value <0.05, and ** denotes q‐value <0.01.