
Figure 2.
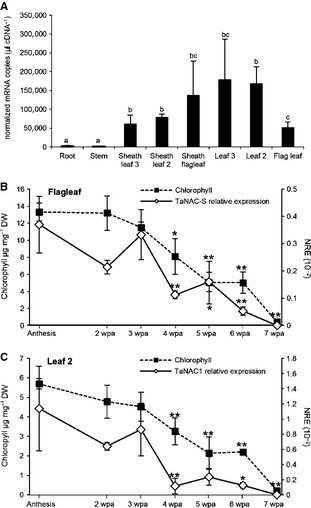
A: Absolute real‐time PCR transcript analysis of TaNAC‐S in different canopy tissues of wheat. Each value is normalised against the control gene, as described in the text. Each bar represents mean ± SE of at least three biological replicates. Different letters indicate differences significant at 0.05 level. B: Relative TaNAC‐S gene expression analysis in relation to post‐anthesis chlorophyll content/senescence in the flag leaf and C: leaf 3 of wheat cv. Cadenza determined with SYBR‐Green real‐time PCR. NRE: Constitutive control gene Normalised Relative Expression as described in text; values are means ± SEM (n = 3). **P < 0.01, *P < 0.05 significantly different changes in time compared to anthesis; wpa, weeks post‐anthesis.