
Figure 6.
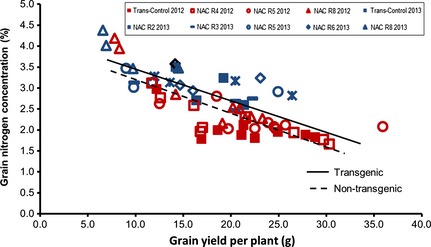
Linear regression between grain yield per plant (GY) and grain N concentration (GNC) of transgenic lines and controls. Data are from two independent glasshouse experiments; the first with three transgenic lines (R4, R5 and R8, conducted in 2012) and second with five lines (R2, R3, R5, R6 and R8, conducted in 2013), transformed but non‐transgene‐containing Cadenza as control. Regression equation for transgenic lines is y = −0.0755x + 4.1261 (R2 = 0.6119) and control lines is y = −0.0796x + 3.953 (R2 = 0.4237). The 2012 data are indicated in red and the 2013 data in blue.