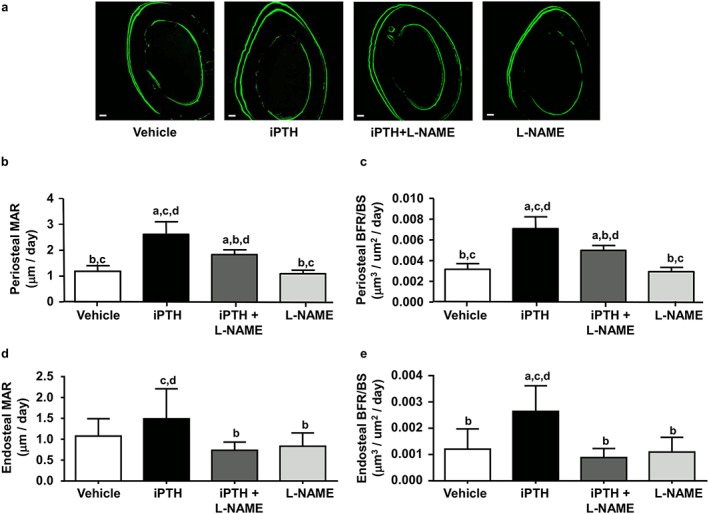
Figure 4.

L‐NAME reduces iPTH‐induced increases in cortical bone formation rate. (a) Representative confocal micrographs of non‐decalcified sections of the femoral mid‐diaphysis, showing the calcein double labels (26 days between both labels) marking bone apposition during the 26 days of dosing with vehicle (control), iPTH and L‐NAME, alone or in combination. Scale bar = 50 µm. (b) Bar graphs of the average periosteal mineral apposition rate (MAR) and (c) periosteal bone formation rate (BFR/BS) for the four groups. (d) Bar graphs of the average endosteal mineral apposition rate (MAR) and (e) endosteal bone formation rate (BFR/BS) for the four groups. Values are mean ± SD, n = 7–8 mice/group; a P < 0.05 versus control; b P < 0.05 versus iPTH; c P < 0.05 versus iPTH + L‐NAME, d P < 0.05 versus L‐NAME
