Figure 6.

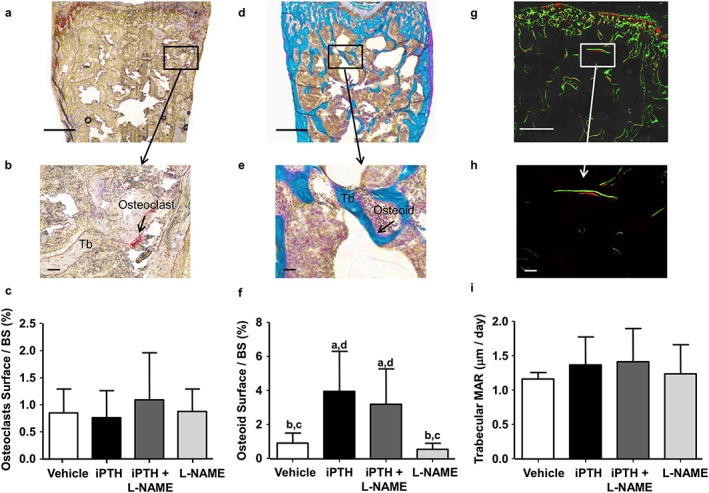
Effects of PTH and L‐NAME on trabecular bone turnover. (a) Representative brightfield micrographs of non‐decalcified sections of secondary spongiosa in the distal femur stained for TRAP (a) or Goldner's trichrome (d) with respective magnified regions demonstrating (b) TRAP‐positive osteoclasts (arrow) or (e) positively stained osteoid (arrow) lining trabeculae (Tb). (g) Representative confocal micrographs of a non‐decalcified section of the secondary spongiosa of the distal femur, showing the fluorescent labels (calcein, green and xylenol orange, red, 5 days between both labels) marking bone apposition during the last 5 days of the 28 day dosing experiment. Scale: bars = 500 µm in top row images and bars = 50 µm in second row images. Bar graphs (C, F, I) summarize the different histomorphometric parameters in trabecular bone at the end of the 28‐day treatment with vehicle (control), PTH 1–34 (80μg/kg/d) and L‐NAME (30 mg/kg/d), alone or in combination including: (c) percentage of osteoclast surface per bone surface, (f) percentage of osteoid surface per bone surface and (i) mineral apposition rate (MAR). Values are mean ± SD, n = 7–8 mice/group; a P < 0.05 versus control; b P < 0.05 versus iPTH; c P < 0.05 versus iPTH + L‐NAME, d P < 0.05 versus L‐NAME
