
Figure 1.
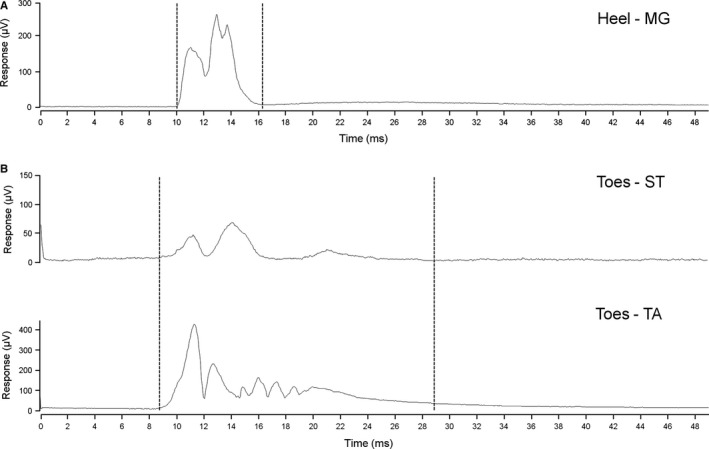
Example electromyogram recordings and analysis time windows of reflex responses in (A) medial gastrocnemius (MG) and (B) semitendinosus (ST)/tibialis anterior (TA) to electrical stimulation of the heel and toes, respectively. Each record is the average of eight sweeps and the stimulus was applied at the beginning of each sweep. Placement of cursors for measurement of the voltage/time integral (area) of the response is indicated by the dashed lines.