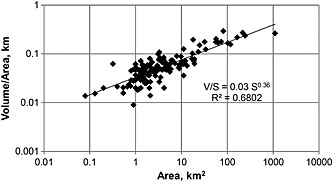
Figure 2.

Average glacier thickness approximated as the volume divided by area. For the 144 glaciers compiled in Bahr et al. [1997], the data show an apparent power law trend between the thickness and the area. A simple regression is consistent with the theory (γ = 1.375 in theory, and γ − 1 = 0.36 in this plot), a necessary though not sufficient condition for testing a power law hypothesis. The scaling hypothesis should also be tested with more sophisticated statistical techniques [Clauset et al., 2009] that are beyond the scope of this review but have been analyzed in detail elsewhere [Grinsted, 2013; Bahr and Radić, 2012]. However, with less than 2 orders of magnitude in thickness in this plot, noise becomes problematic and a power law hypothesis is difficult to assess (see the theoretical reasons for this noise at the beginning of section 7). The general scaling theory might be better tested with one of the many alternative scaling relationships derived in the text (e.g., equation (138)) and elsewhere [e.g., Bahr, 1997a].
