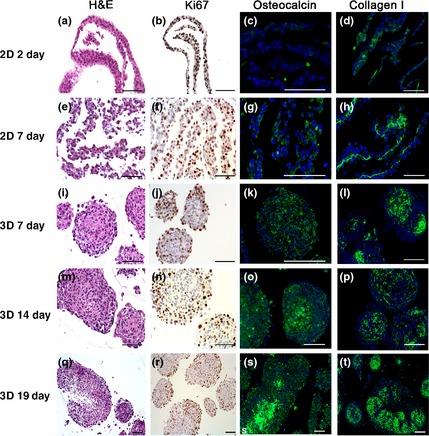
Figure 2.

Histochemical and immunohistochemical staining on 2D monolayer (a–h) and three‐dimensional spheroid (e–t) cell culture. The illustrated samples were stained for H&E (a, e, j, m, q) as well as immunostained for Ki‐67 proliferation marker (b, f, j, n, r), osteocalcin (c, g, k, o, s) as an indicator for calcification and collagen I (d, h, l, p, t) for fibre demonstration. Scale bars = 100 μm.
