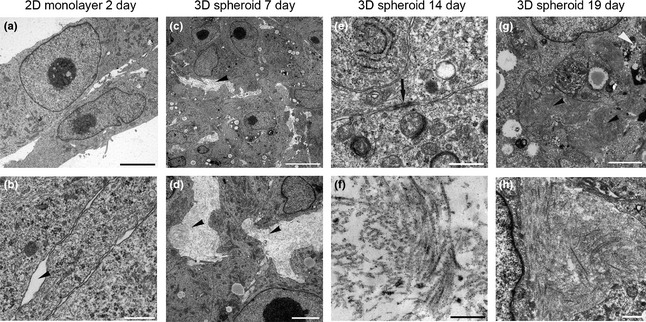
Figure 4.

Transmission electron microscopy images of two‐dimensional (2D) monolayers and three‐dimensional (3D) spheroids generated from canine osteosarcoma cells (D17). Characteristic 2D monolayer cells cultivated for 2 days show tight cell contacts lacking signs of extracellular matrix structures between cells (a, b). Scale bars = 5 μm. Inter‐cellular space marked by arrowhead (b). Note viable tumour cells with characteristic nuclei with the prominent nucleoli in spheroids cultivated for 7 day (c). Inter‐cellular space provided with collagen; arrowheads (c, d). Scale bar = 2.5 μm. Undefined electron‐dense agglomerates at the cell membranes with tight cell–cell contacts within the spheroids (black arrow) in spheroids after 14 day in culture (e). Collagen I fibres were clearly identified in inter‐cellular space of spheroids cultivated for 14 day (f). Scale bar = 0.5 μm. After 19 days of culture, the amount of lipid droplets as well the amount of necrotic cells (black arrowhead) was increased (g). Scale bar = 2.5 μm. Densely arranged collagen I fibres predominated the extracellular space in 19‐day spheroids (h). Scale bar = 0.5 μm.
