
Figure 2.
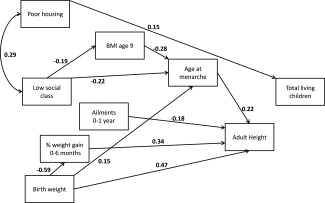
Path diagram showing statistically significant (P < 0.05) pathways between adversity at birth and total surviving children. Standardized beta coefficients are given. The model was fitted with robust standard errors; error terms are omitted for simplicity. Fit statistic: CD = 0.143.