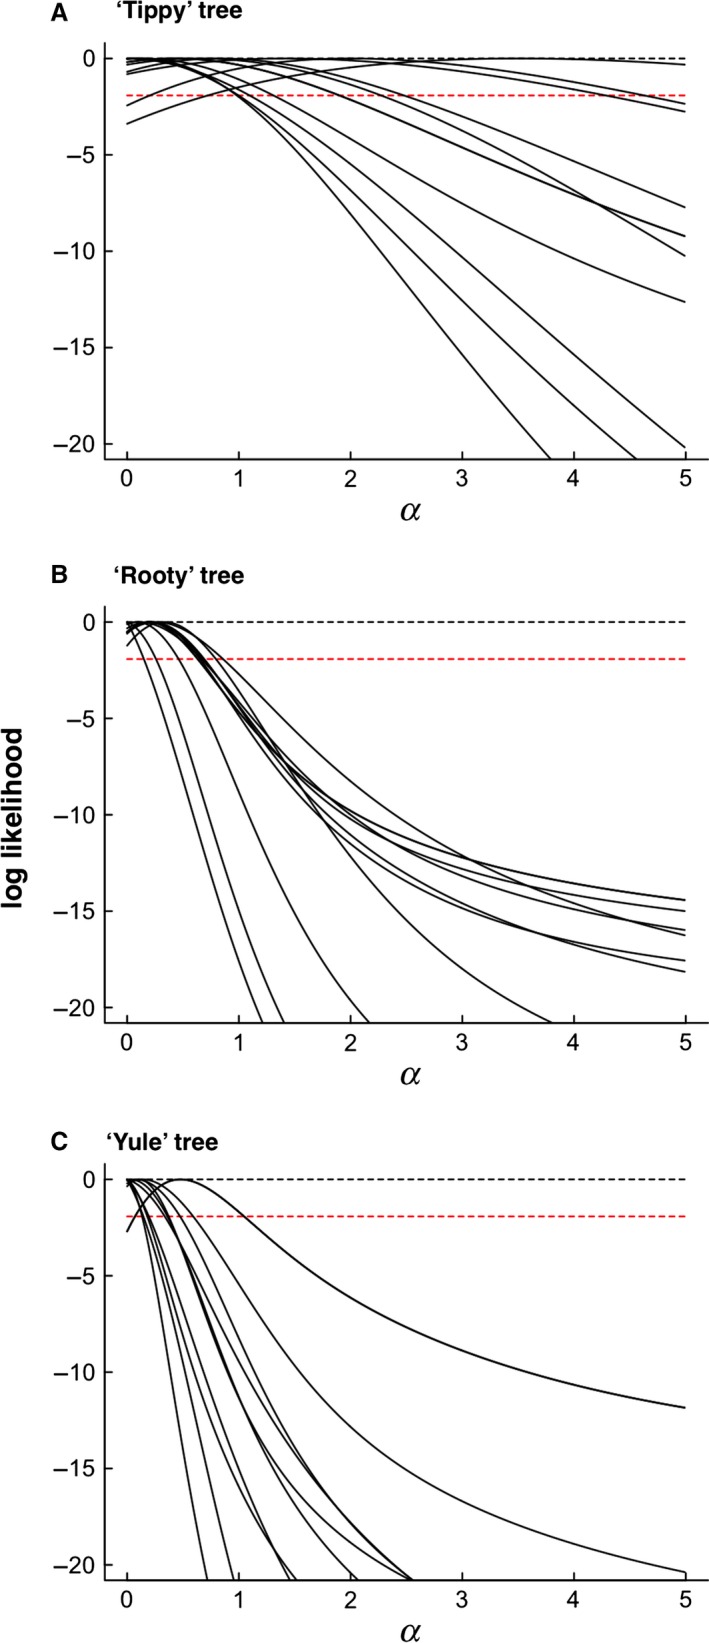
Figure 2.

Examples of profile likelihoods for selected simulated datasets for tippy (A), rooty (B) and Yule (C) simulated trees of 50 taxa. Each solid black line represents one simulated dataset selected at random. Tippy trees are those with branching events distributed disproportionately late in the clade's history (i.e. nearer to the present). Rooty trees are those with branching events distributed disproportionately early in the clade's history (i.e. nearer to the root). In all cases the ‘true’ value of α is 0 (black dashed line). The red dashed line represents −1.92 log‐likelihood units from the maximum: using log‐Likelihood ratio tests, values of α yielding values higher than this would be considered statistically indistinguishable from the Maximum Likelihood value.
