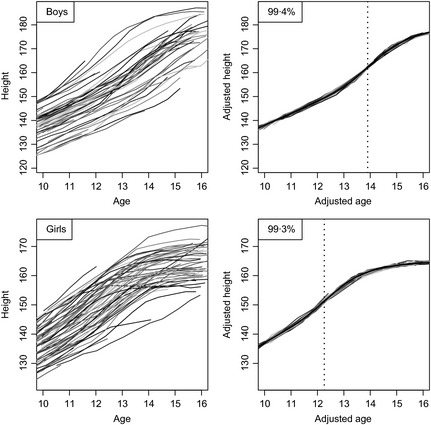
Figure 1.

Growth curves of height in boys (above, n = 54) and girls (below, n = 70), unadjusted (left) and after super‐imposition by translation and rotation (SITAR) adjustment (right). The mean curves are shown in black, and the ages at peak height velocity are shown as dotted lines.
