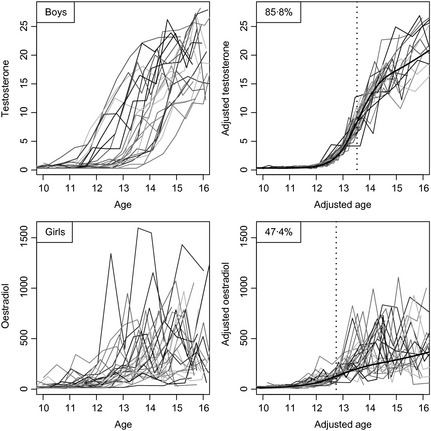
Figure 3.

Growth curves of testosterone in boys (above, n = 24) and oestradiol in girls (below, n = 27), unadjusted (left) and after super‐imposition by translation and rotation (SITAR) adjustment (right). The mean curves are shown in black, and the ages at peak velocity are shown as dotted lines.
