
Figure 1.
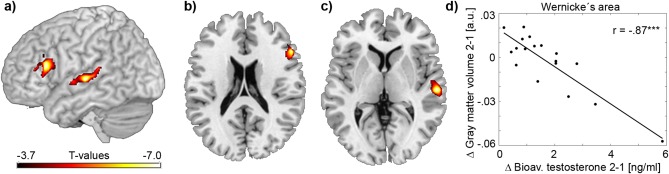
Associations between bioavailable testosterone and GMV. Voxel‐wise linear regression analysis was conducted between changes in bioavailable testosterone and changes in GMV between MRI scan 1 and scan 2. Results are superimposed on a 3D surface of the brain (a) and on axial slices at z = 20 mm (b) and z = 4 mm (c), P < 0.05 FWE‐corrected for multiple comparisons at cluster level. Significant negative associations were observed in the left inferior frontal gyrus (b, peak voxel t = −7.55, x/y/z = −54/23/15 mm, mean cluster t = −4.63, cluster size = 1985 mm3) and the left middle superior temporal gyrus (c, peak t = −7.08, x/y/z = −60/‐21/1 mm, mean cluster t = −4.60, cluster size = 2396 mm3). The scatterplot exemplarily represents the association at the peak voxel in the left middle superior temporal gyrus (d). r: Pearson's correlation coefficient. ***P < 0.001 uncorrected. Axial slices are in radiological convention (left is right). [Color figure can be viewed in the online issue, which is available at http://wileyonlinelibrary.com.]