
Figure 1.
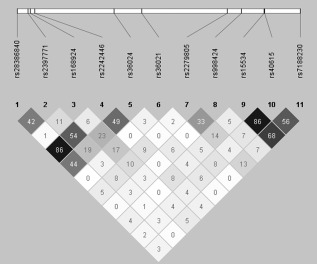
Linkage disequilibrium plot of single nucleotide polymorphisms (SNPs) considered for inclusion. Depicted are 11 genotyped SNPs and the pairwise R 2 between them. At the top are the relative positions of the SNPs to one another on the NET gene. Below are the rs numbers for each corresponding SNP and the color scheme shows the strength of the of their R 2 value. White= R 2= 0, shades of gray = 0 < R 2 < 1 and black = R 2 = 1.